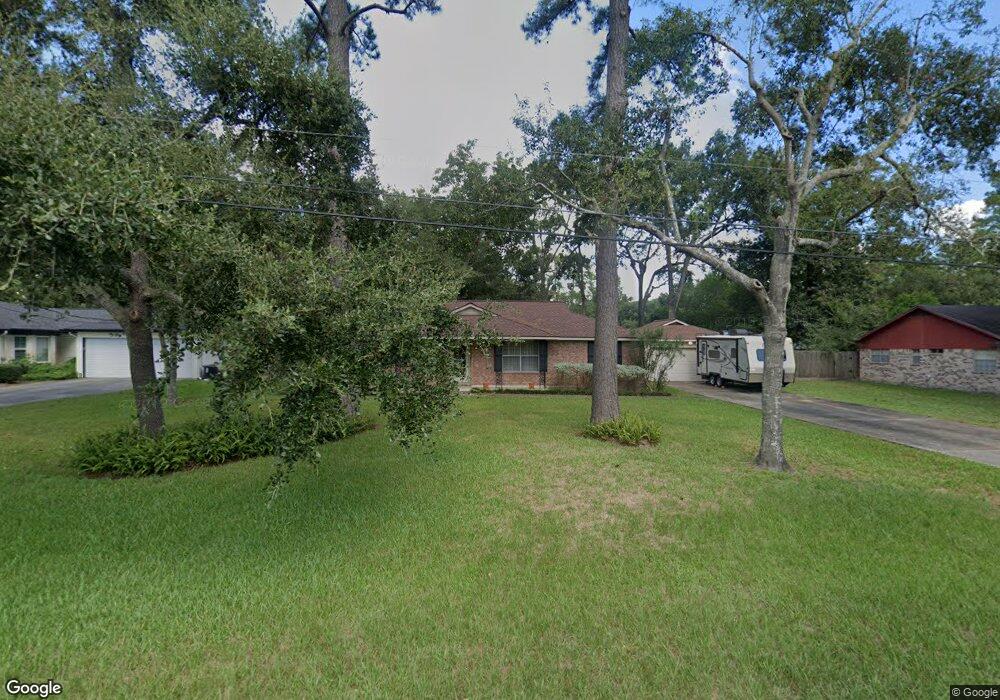
14174 Turnervine Dr Tomball, TX 77375
Estimated Value: $271,914 - $323,000
3
Beds
2
Baths
1,632
Sq Ft
$181/Sq Ft
Est. Value
About This Home
This home is located at 14174 Turnervine Dr, Tomball, TX 77375 and is currently estimated at $295,729, approximately $181 per square foot. 14174 Turnervine Dr is a home located in Harris County with nearby schools including Tomball Elementary School, Tomball Intermediate School, and Tomball Junior High School.
Ownership History
Date
Name
Owned For
Owner Type
Purchase Details
Closed on
Dec 20, 2016
Sold by
Denny Michael S
Bought by
Denny Michael S
Current Estimated Value
Purchase Details
Closed on
Apr 28, 2003
Sold by
Stevens Charles R and Stevens Patricia G
Bought by
Denny Michael S and Denny Felicia M
Home Financials for this Owner
Home Financials are based on the most recent Mortgage that was taken out on this home.
Original Mortgage
$89,500
Outstanding Balance
$38,927
Interest Rate
5.8%
Estimated Equity
$256,802
Purchase Details
Closed on
Dec 13, 2001
Sold by
Mata Joan
Bought by
Stevens Charles R and Stevens Patricia G
Home Financials for this Owner
Home Financials are based on the most recent Mortgage that was taken out on this home.
Original Mortgage
$101,150
Interest Rate
5.37%
Create a Home Valuation Report for This Property
The Home Valuation Report is an in-depth analysis detailing your home's value as well as a comparison with similar homes in the area
Home Values in the Area
Average Home Value in this Area
Purchase History
| Date | Buyer | Sale Price | Title Company |
|---|---|---|---|
| Denny Michael S | -- | None Available | |
| Denny Michael S | -- | Stewart Title | |
| Stevens Charles R | -- | Alamo Title Company |
Source: Public Records
Mortgage History
| Date | Status | Borrower | Loan Amount |
|---|---|---|---|
| Open | Denny Michael S | $89,500 | |
| Previous Owner | Stevens Charles R | $101,150 |
Source: Public Records
Tax History Compared to Growth
Tax History
| Year | Tax Paid | Tax Assessment Tax Assessment Total Assessment is a certain percentage of the fair market value that is determined by local assessors to be the total taxable value of land and additions on the property. | Land | Improvement |
|---|---|---|---|---|
| 2025 | $3,980 | $259,121 | $54,427 | $204,694 |
| 2024 | $3,980 | $259,121 | $54,427 | $204,694 |
| 2023 | $3,980 | $246,953 | $50,014 | $196,939 |
| 2022 | $4,510 | $204,233 | $41,924 | $162,309 |
| 2021 | $4,314 | $181,888 | $36,775 | $145,113 |
| 2020 | $4,112 | $167,652 | $36,775 | $130,877 |
| 2019 | $4,175 | $165,505 | $30,891 | $134,614 |
| 2018 | $1,985 | $173,104 | $30,891 | $142,213 |
| 2017 | $4,362 | $173,104 | $30,891 | $142,213 |
| 2016 | $3,842 | $152,466 | $30,891 | $121,575 |
| 2015 | $3,216 | $146,382 | $30,891 | $115,491 |
| 2014 | $3,216 | $141,629 | $30,891 | $110,738 |
Source: Public Records
Map
Nearby Homes
- 14219 Turnervine Dr
- 11211 Stirton Dr
- 11235 Stirton Dr
- 14123 Spring Pines Dr
- 14222 Spring Pines Dr
- 1319 Pine Trail
- 1310 Big Pines
- 1315 Big Pines
- 1314 Pine Brook
- 29507 Cedar Elm Way
- 14210 Altair Dr
- 1302 Pine Trail
- 930 Arbor Pine
- 1602 Alpine Dr
- 14134 Pollux Ct
- 31318 Bearing Star Ln
- 0 Keen Rd
- 28102 Linda Ln
- 31335 Bearing Star Ln
- 1126 Audrey Trail
- 14166 Turnervine Dr
- 14202 Turnervine Dr
- 14175 Buckingham Ln
- 14203 Buckingham Ln
- 14158 Turnervine Dr
- 14167 Buckingham Ln
- 14210 Turnervine Dr
- 14175 Turnervine Dr
- 14161 Turnervine Dr
- 14211 Buckingham Ln
- 14159 Buckingham Ln
- 14159 Turnervine Dr
- 14156 Turnervine Dr
- 14212 Turnervine Dr
- 14218 Turnervine Dr
- 14219 Buckingham Ln
- 14151 Buckingham Ln
- 14151 Turnervine Dr
- 14202 Buckingham Ln
- 14210 Buckingham Ln