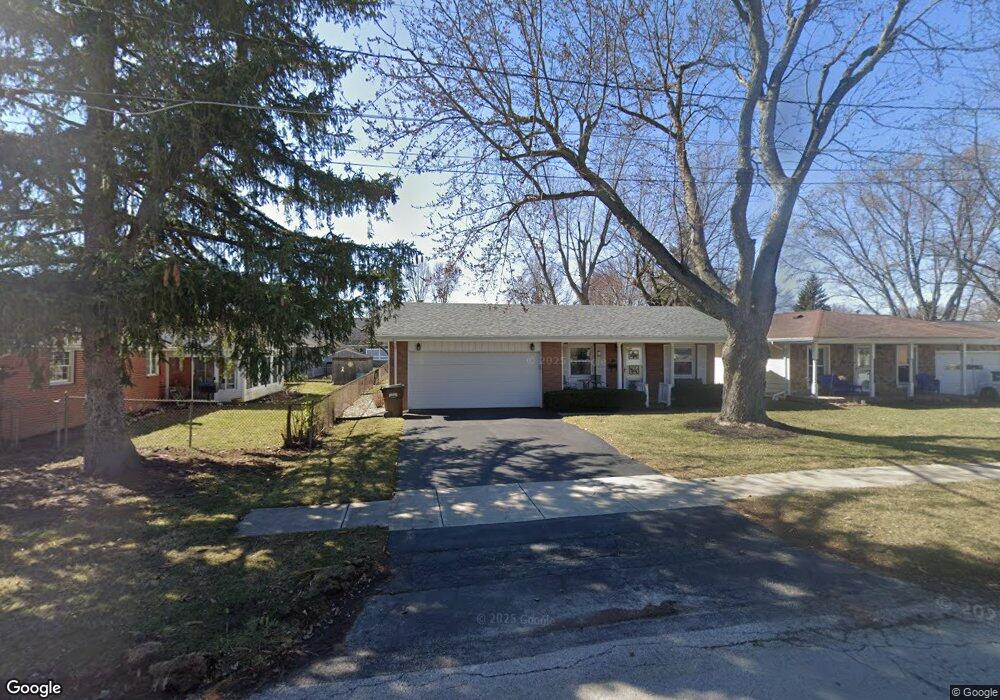
1418 Amelia Ave Findlay, OH 45840
Estimated Value: $190,000 - $218,000
3
Beds
2
Baths
1,161
Sq Ft
$173/Sq Ft
Est. Value
About This Home
This home is located at 1418 Amelia Ave, Findlay, OH 45840 and is currently estimated at $200,670, approximately $172 per square foot. 1418 Amelia Ave is a home located in Hancock County with nearby schools including Wilson Vance Elementary School, Whittier Elementary School, and Donnell Middle School.
Ownership History
Date
Name
Owned For
Owner Type
Purchase Details
Closed on
Oct 15, 2009
Sold by
Placke Ruth A
Bought by
Placke Chester E and Placke Ruth A
Current Estimated Value
Home Financials for this Owner
Home Financials are based on the most recent Mortgage that was taken out on this home.
Original Mortgage
$89,000
Interest Rate
4.5%
Mortgage Type
New Conventional
Purchase Details
Closed on
May 4, 2000
Sold by
Davidson Donald
Bought by
Placke Chester E
Home Financials for this Owner
Home Financials are based on the most recent Mortgage that was taken out on this home.
Original Mortgage
$98,500
Interest Rate
7.86%
Mortgage Type
New Conventional
Purchase Details
Closed on
Dec 2, 1997
Sold by
Tunstall Christopher
Bought by
Davidson Donald and Davidson Lorrie
Home Financials for this Owner
Home Financials are based on the most recent Mortgage that was taken out on this home.
Original Mortgage
$76,000
Interest Rate
7.45%
Mortgage Type
New Conventional
Purchase Details
Closed on
Apr 27, 1987
Bought by
Tunstall Christopher C
Purchase Details
Closed on
Jun 26, 1984
Bought by
Darwactor Rita R
Create a Home Valuation Report for This Property
The Home Valuation Report is an in-depth analysis detailing your home's value as well as a comparison with similar homes in the area
Home Values in the Area
Average Home Value in this Area
Purchase History
| Date | Buyer | Sale Price | Title Company |
|---|---|---|---|
| Placke Chester E | -- | Whitman Title Security | |
| Placke Chester E | $98,500 | -- | |
| Davidson Donald | $89,500 | -- | |
| Tunstall Christopher C | $51,500 | -- | |
| Darwactor Rita R | $45,000 | -- |
Source: Public Records
Mortgage History
| Date | Status | Borrower | Loan Amount |
|---|---|---|---|
| Previous Owner | Placke Chester E | $89,000 | |
| Previous Owner | Placke Chester E | $98,500 | |
| Previous Owner | Davidson Donald | $76,000 |
Source: Public Records
Tax History Compared to Growth
Tax History
| Year | Tax Paid | Tax Assessment Tax Assessment Total Assessment is a certain percentage of the fair market value that is determined by local assessors to be the total taxable value of land and additions on the property. | Land | Improvement |
|---|---|---|---|---|
| 2024 | $1,559 | $53,670 | $6,510 | $47,160 |
| 2023 | $1,584 | $53,670 | $6,510 | $47,160 |
| 2022 | $1,593 | $53,670 | $6,510 | $47,160 |
| 2021 | $1,331 | $41,440 | $6,510 | $34,930 |
| 2020 | $1,330 | $41,440 | $6,510 | $34,930 |
| 2019 | $1,304 | $41,440 | $6,510 | $34,930 |
| 2018 | $1,188 | $36,040 | $5,660 | $30,380 |
| 2017 | $593 | $36,040 | $5,660 | $30,380 |
| 2016 | $1,178 | $36,040 | $5,660 | $30,380 |
| 2015 | $1,140 | $34,830 | $6,080 | $28,750 |
| 2014 | $1,056 | $32,900 | $6,080 | $26,820 |
| 2012 | $1,043 | $32,360 | $6,080 | $26,280 |
Source: Public Records
Map
Nearby Homes
- 1200 5th St
- 1011 Stall Dr
- 1008 Eastview Dr
- 0 Blanchard Ave
- 1301 Fishlock Ave
- 1709 Eastview Dr
- 1726 Eastview Dr
- 1109 Brookside Dr
- 804 6th St
- 1802 Lippincott Ave
- 1037 Fishlock Ave
- 1006 Selby St
- 1000 Tarra Oaks Dr
- 904 Morse St
- 15591 Canadian Way
- 15586 Canadian Way
- 15615 Canadian Way
- 820 Selby St
- 1464 Misty Oaks Dr
- 1109 Park St