1418 E 9th St Reno, NV 89512
Northeast Reno NeighborhoodEstimated Value: $186,444 - $203,000
2
Beds
1
Bath
832
Sq Ft
$236/Sq Ft
Est. Value
About This Home
This home is located at 1418 E 9th St, Reno, NV 89512 and is currently estimated at $196,361, approximately $236 per square foot. 1418 E 9th St is a home located in Washoe County with nearby schools including Glenn Duncan STEM Academy, Fred W. Traner Middle School, and Procter R. Hug High School.
Ownership History
Date
Name
Owned For
Owner Type
Purchase Details
Closed on
Dec 13, 2024
Sold by
Codling Trust and Codling Eileen M
Bought by
Schattauer Elisabeth
Current Estimated Value
Purchase Details
Closed on
Apr 24, 2022
Sold by
Chaitanya Ingle
Bought by
Codling Trust
Purchase Details
Closed on
May 16, 2018
Sold by
Myers Timothy Robert
Bought by
Ingle Chaitanya and Palaganas Haley
Home Financials for this Owner
Home Financials are based on the most recent Mortgage that was taken out on this home.
Original Mortgage
$116,400
Interest Rate
4.4%
Mortgage Type
New Conventional
Purchase Details
Closed on
Dec 28, 2017
Sold by
Tbr I Llc
Bought by
Myres Timothy Rober and Tm Family Trust
Purchase Details
Closed on
Aug 11, 2014
Sold by
Kern & Associates Ltd
Bought by
Tbr I Llc
Purchase Details
Closed on
Aug 15, 2007
Sold by
Peltier Therese H
Bought by
Peltier Gary
Purchase Details
Closed on
May 16, 2006
Sold by
Peltier Therese H
Bought by
Peltier Gary
Create a Home Valuation Report for This Property
The Home Valuation Report is an in-depth analysis detailing your home's value as well as a comparison with similar homes in the area
Home Values in the Area
Average Home Value in this Area
Purchase History
| Date | Buyer | Sale Price | Title Company |
|---|---|---|---|
| Schattauer Elisabeth | $190,000 | Stewart Title | |
| Schattauer Elisabeth | $190,000 | Stewart Title | |
| Codling Trust | $210,000 | Ticor Title | |
| Ingle Chaitanya | $151,000 | Western Title Co | |
| Myres Timothy Rober | $109,000 | Western Title Co | |
| Tbr I Llc | $24,600 | None Available | |
| Peltier Gary | -- | None Available | |
| Peltier Gary | -- | Marquis Title | |
| Peltier Gary | -- | Marquis Title |
Source: Public Records
Mortgage History
| Date | Status | Borrower | Loan Amount |
|---|---|---|---|
| Previous Owner | Ingle Chaitanya | $116,400 |
Source: Public Records
Tax History
| Year | Tax Paid | Tax Assessment Tax Assessment Total Assessment is a certain percentage of the fair market value that is determined by local assessors to be the total taxable value of land and additions on the property. | Land | Improvement |
|---|---|---|---|---|
| 2026 | $326 | $28,482 | $15,505 | $12,977 |
| 2024 | $318 | $28,733 | $14,700 | $14,033 |
| 2023 | $309 | $27,117 | $14,490 | $12,627 |
| 2022 | $0 | $22,959 | $11,900 | $11,059 |
Source: Public Records
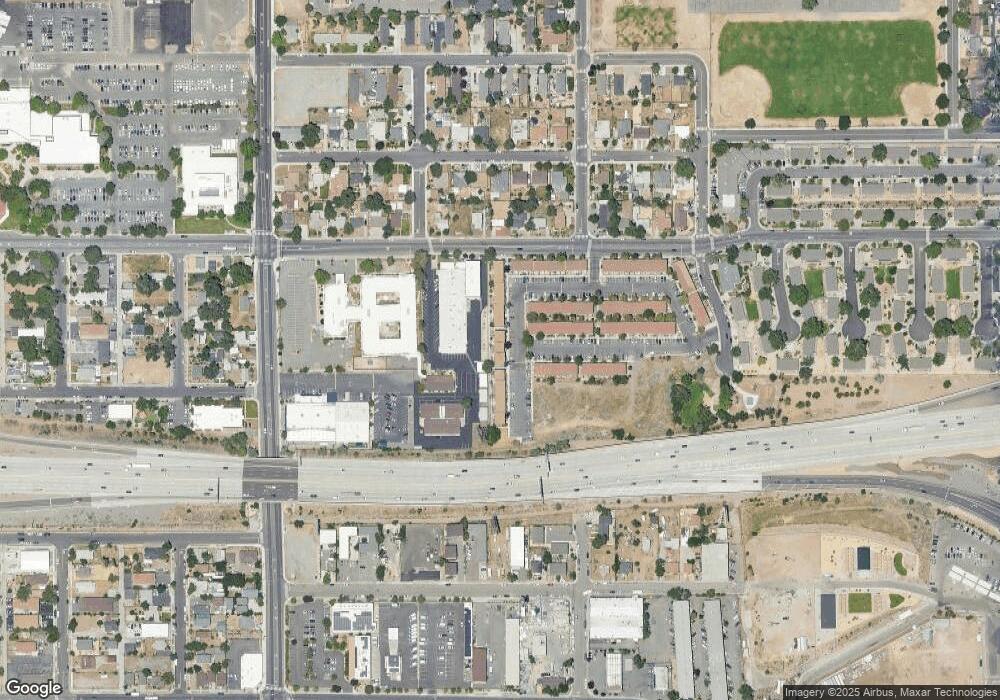
Map
Nearby Homes
- 1414 E 9th St Unit 4
- 920 Montello St
- 1281 E 10th St
- 1545 Haddock Dr
- 1885 Castle Way
- 1675 Trainer Way
- 750 Southworth Dr
- 1810 Citron St
- 901 Southworth Dr
- 74 Lilac Ln
- 168 Poppy Ln
- 180 Poppy Ln
- 135 Carnation Ln
- 650 Denslowe Dr
- 462 Laurel St
- 540 Cranleigh Dr
- 1925 Citron St
- 112 Lilac Ln
- 113 Lilac Ln
- 442 E 7th St Unit 1 & 2
- 1418 E 9th St
- 1418 E 9th St
- 1418 E 9th St Unit 3A3U
- 1418 E 9th St Unit A2U
- 1418 E 9th St
- 1418 E 9th St Unit B3
- 1418 E 9th St Unit B2
- 1418 E 9th St Unit 3B1
- 1418 E 9th St Unit 7
- 1418 E 9th St Unit 8
- 1418 E 9th St Unit 3
- 1418 E 9th St Unit 1
- 1418 E 9th St Unit 4
- 1418 E 9th St Unit 9
- 1418 E 9th St Unit 6
- 1418 E 9th St Unit 2
- 1418 E 9th St Unit 5
- 1416 E Ninth St
- 1416 E Ninth St Unit 6
- 1416 E Ninth St Unit 5