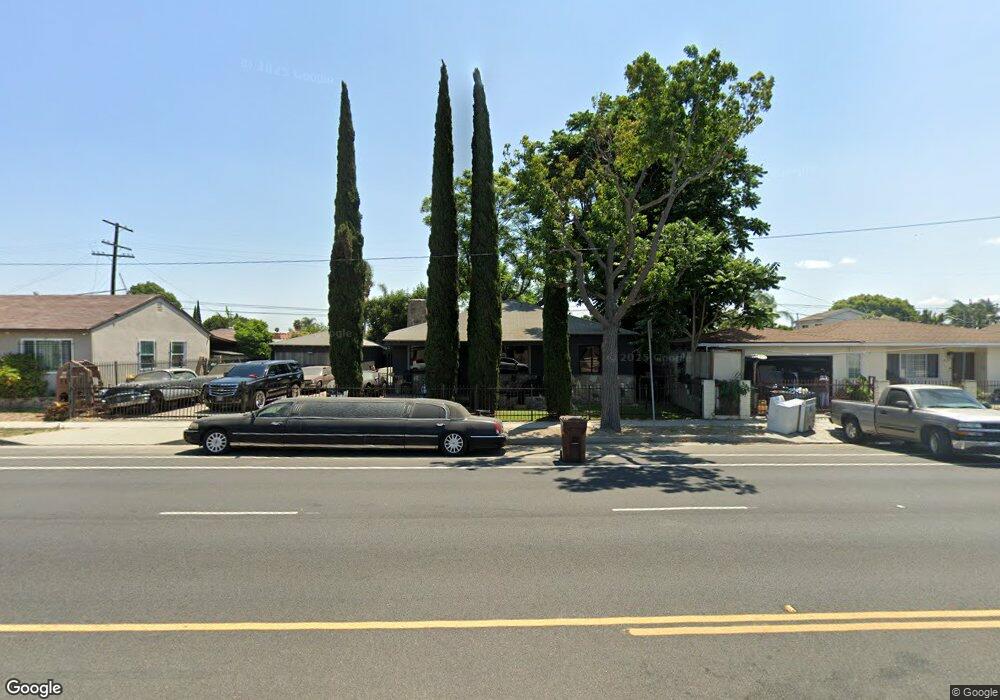
1418 N Santa fe Ave Compton, CA 90221
Estimated Value: $619,000 - $650,721
About This Home
This home is located at 1418 N Santa fe Ave, Compton, CA 90221 and is currently estimated at $639,180, approximately $427 per square foot. 1418 N Santa fe Ave is a home located in Los Angeles County with nearby schools including Mayo Elementary School, Whaley Middle School, and Dominguez High School.
Ownership History
We collect this data history from publicly available records. To have your information removed, we recommend requesting removal directly through your county’s website.
Purchase Details
Purchase Details
Home Financials for this Owner
Home Financials are based on the most recent Mortgage that was taken out on this home.Purchase Details
Home Financials for this Owner
Home Financials are based on the most recent Mortgage that was taken out on this home.Home Values in the Area
Average Home Value in this Area
Purchase History
We collect this data history from publicly available records. To have your information removed, we recommend requesting removal directly through your county’s website.
| Date | Buyer | Sale Price | Title Company |
|---|---|---|---|
| -- | None Listed On Document | ||
| -- | American Title | ||
| $103,000 | First American Title Co |
Mortgage History
We collect this data history from publicly available records. To have your information removed, we recommend requesting removal directly through your county’s website.
| Date | Status | Borrower | Loan Amount |
|---|---|---|---|
| Previous Owner | $97,000 | ||
| Previous Owner | $92,610 |
Tax History
We collect this data history from publicly available records. To have your information removed, we recommend requesting removal directly through your county’s website.
| Year | Tax Paid | Tax Assessment Tax Assessment Total Assessment is a certain percentage of the fair market value that is determined by local assessors to be the total taxable value of land and additions on the property. | Land | Improvement |
|---|---|---|---|---|
| 2025 | $3,710 | $172,974 | $98,079 | $74,895 |
| 2024 | $3,689 | $169,583 | $96,156 | $73,427 |
| 2023 | $3,636 | $166,259 | $94,271 | $71,988 |
| 2022 | $3,135 | $163,000 | $92,423 | $70,577 |
| 2021 | $3,153 | $159,805 | $90,611 | $69,194 |
| 2019 | $3,068 | $155,067 | $87,924 | $67,143 |
| 2018 | $2,940 | $152,027 | $86,200 | $65,827 |
| 2016 | $2,794 | $146,125 | $82,853 | $63,272 |
| 2015 | $2,680 | $143,931 | $81,609 | $62,322 |
| 2014 | $2,638 | $141,113 | $80,011 | $61,102 |
Map
- 1609 N Pearl Ave
- 1218 N Spring Ave
- 1415 N Spring Ave
- 1307 E Peck St
- 1004 N Poinsettia Ave
- 511 N Chester Ave
- 212 E Rosecrans Ave
- 1111 N Mulberry St
- 904 E Stockton Ave
- 812 N Poinsettia Ave
- 3130 Euclid Ave
- 1116 E Stockton Ave
- 1009 E Stockton Ave
- 411 N Chester Ave
- 3218 Euclid Ave
- 706 E Palmer St
- 1508 E Queensdale St
- 3150 -62 Euclid Ave
- 1616 N Willowbrook Ave
- 204 N Spring Ave
- 1500 N Santa fe Ave
- 1414 N Santa fe Ave
- 1507 N Chester Ave
- 1503 N Chester Ave
- 1511 N Chester Ave
- 1504 N Santa fe Ave
- 1415 N Chester Ave
- 1515 N Chester Ave
- 1410 N Santa fe Ave
- 1411 N Chester Ave
- 1510 N Santa fe Ave
- 1603 N Chester Ave
- 1423 N Santa fe Ave
- 1417 N Santa fe Ave
- 1501 N Santa fe Ave
- 1415 N Santa fe Ave
- 1405 N Chester Ave
- 1507 N Santa fe Ave
- 1408 N Santa fe Ave
- 1607 N Chester Ave
Ask me questions while you tour the home.