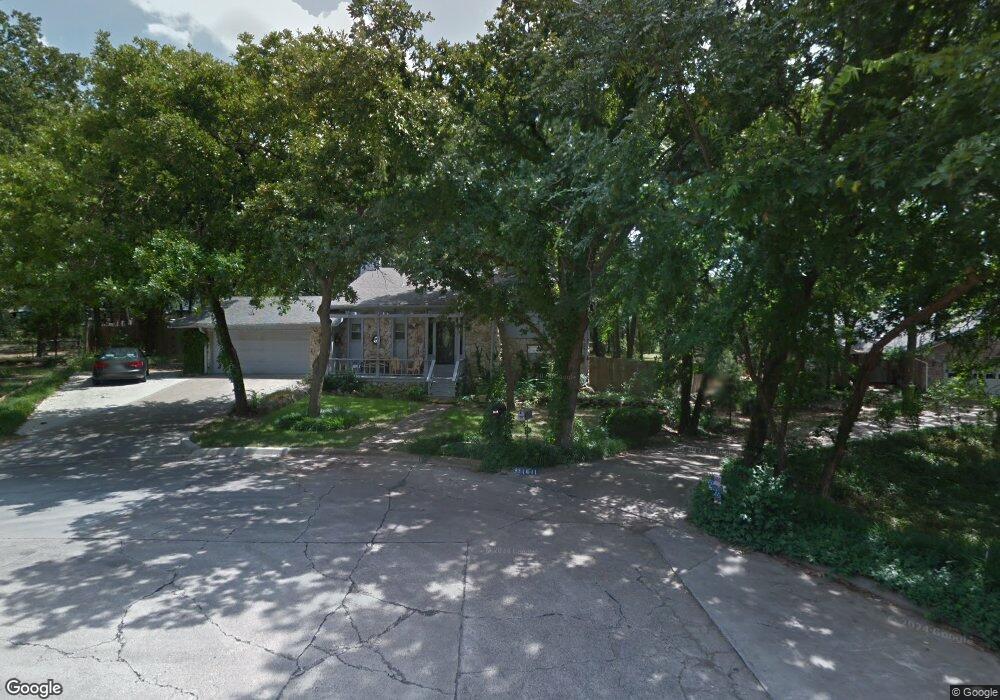
1418 Oakridge Rd Ardmore, OK 73401
Estimated Value: $290,269 - $356,000
3
Beds
3
Baths
2,366
Sq Ft
$132/Sq Ft
Est. Value
About This Home
This home is located at 1418 Oakridge Rd, Ardmore, OK 73401 and is currently estimated at $312,317, approximately $132 per square foot. 1418 Oakridge Rd is a home located in Carter County with nearby schools including Plainview Primary School, Plainview Intermediate School, and Plainview Middle School.
Ownership History
Date
Name
Owned For
Owner Type
Purchase Details
Closed on
Feb 29, 2008
Sold by
Richey Bennett and Richey Tiffany
Bought by
Bowen William R and Bowen Christina
Current Estimated Value
Home Financials for this Owner
Home Financials are based on the most recent Mortgage that was taken out on this home.
Original Mortgage
$136,000
Outstanding Balance
$24,010
Interest Rate
5.68%
Mortgage Type
New Conventional
Estimated Equity
$288,307
Purchase Details
Closed on
Jun 20, 2005
Sold by
Hammond Bruce Tod and Hammond Shana Tate
Bought by
Richey Bennett and Richey Tiffany
Home Financials for this Owner
Home Financials are based on the most recent Mortgage that was taken out on this home.
Original Mortgage
$128,976
Interest Rate
5.76%
Mortgage Type
FHA
Purchase Details
Closed on
Mar 21, 2002
Sold by
Mckinnie Scott and Mckinnie Lynda
Bought by
Hammond Bruce Tod and Hammond Sha
Purchase Details
Closed on
Apr 13, 1998
Sold by
Chapman James A
Bought by
Mckinnie Scott and Mckinnie Lynda
Create a Home Valuation Report for This Property
The Home Valuation Report is an in-depth analysis detailing your home's value as well as a comparison with similar homes in the area
Home Values in the Area
Average Home Value in this Area
Purchase History
| Date | Buyer | Sale Price | Title Company |
|---|---|---|---|
| Bowen William R | $156,000 | -- | |
| Richey Bennett | $131,000 | -- | |
| Hammond Bruce Tod | $125,000 | -- | |
| Mckinnie Scott | $108,000 | -- |
Source: Public Records
Mortgage History
| Date | Status | Borrower | Loan Amount |
|---|---|---|---|
| Open | Bowen William R | $136,000 | |
| Previous Owner | Richey Bennett | $128,976 |
Source: Public Records
Tax History Compared to Growth
Tax History
| Year | Tax Paid | Tax Assessment Tax Assessment Total Assessment is a certain percentage of the fair market value that is determined by local assessors to be the total taxable value of land and additions on the property. | Land | Improvement |
|---|---|---|---|---|
| 2025 | $1,964 | $22,406 | $3,600 | $18,806 |
| 2024 | $1,964 | $21,753 | $3,600 | $18,153 |
| 2023 | $1,904 | $21,120 | $3,600 | $17,520 |
| 2022 | $1,767 | $20,505 | $3,600 | $16,905 |
| 2021 | $1,762 | $19,908 | $3,600 | $16,308 |
| 2020 | $1,726 | $19,328 | $3,600 | $15,728 |
| 2019 | $1,713 | $19,677 | $3,600 | $16,077 |
| 2018 | $1,758 | $20,359 | $3,600 | $16,759 |
| 2017 | $1,845 | $21,215 | $3,600 | $17,615 |
| 2016 | $1,827 | $20,914 | $2,411 | $18,503 |
| 2015 | $1,823 | $20,305 | $1,338 | $18,967 |
| 2014 | $1,888 | $20,943 | $1,338 | $19,605 |
Source: Public Records
Map
Nearby Homes
- 1121 Surrey Dr
- 1006 S Rockford Rd
- 0 John Rd
- 2222 Cloverleaf Place
- 2212 Cloverleaf Place
- 2200 Cloverleaf Place
- 1223 Buckingham
- 1702 Olive St
- 3209 Myall St
- 1834 Sunset Park Terrace
- 1319 Brookhaven St
- 811 Rosewood St
- 820 Virginia Ln
- 1831 Sunset Park Terrace
- 835 Sunset Ct
- 1508 Sunny Ln
- 1602 Rosedale St
- 1507 Sunny Ln
- 1500 Rosedale St
- 1501 Rosedale St
- 1411 Oakridge Rd
- 1233 Rockford Rd S
- 1233 S Rockford Rd
- 1414 Oakridge Rd
- 1239 Rockford Rd S
- 1239 S Rockford Rd
- 1231 Rockford Rd S
- 1227 Rockford Rd S
- 1227 S Rockford Rd
- 1409 Oakridge Rd
- 1410 Oakridge Rd
- 1223 Rockford Rd S
- 1243 Rockford Rd S
- 1407 Oakridge Rd
- 1236 Rockford Rd S
- 1404 Oak Ridge Rd
- 1406 Oakridge Rd
- 1219 Rockford Rd S
- 1232 S Rockford Rd
- 1232 Rockford Rd S Unit 1