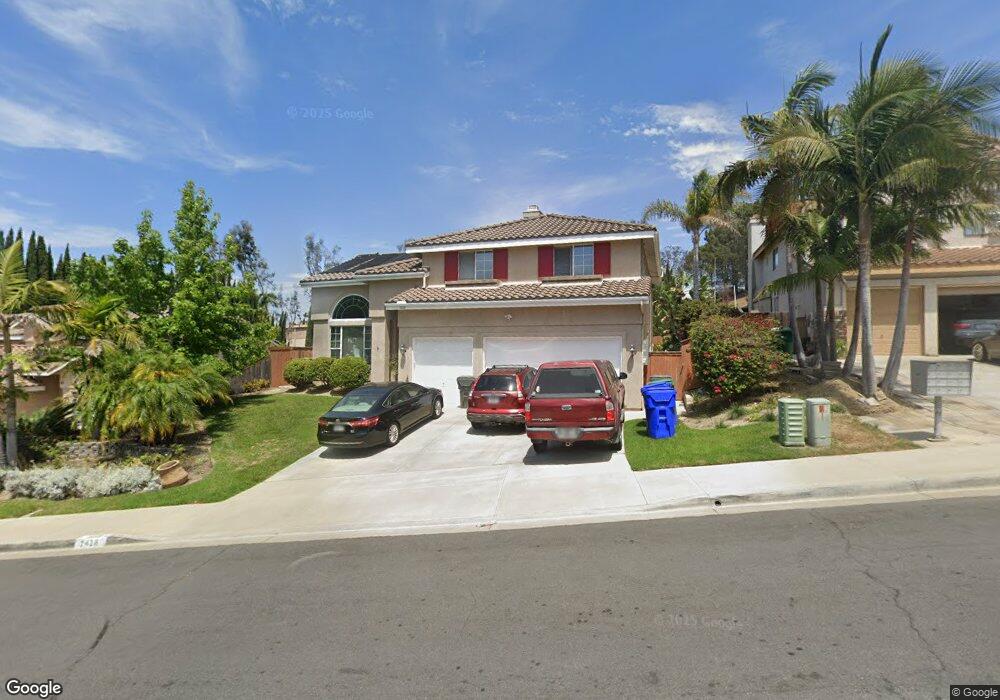
1418 Woodhaven Dr Oceanside, CA 92056
Guajome NeighborhoodEstimated Value: $1,088,530 - $1,174,000
4
Beds
3
Baths
2,797
Sq Ft
$410/Sq Ft
Est. Value
About This Home
This home is located at 1418 Woodhaven Dr, Oceanside, CA 92056 and is currently estimated at $1,145,633, approximately $409 per square foot. 1418 Woodhaven Dr is a home located in San Diego County with nearby schools including Alamosa Park Elementary School, Roosevelt Middle School, and Vista High School.
Ownership History
Date
Name
Owned For
Owner Type
Purchase Details
Closed on
Sep 15, 2021
Sold by
Emerine Biccum Pamela D
Bought by
Emerine Biccum Pamela D and Biccum Bryan Scott
Current Estimated Value
Purchase Details
Closed on
Nov 15, 2014
Sold by
Emerine Biccum Pamela D
Bought by
Emerine Biccum Pamela D
Purchase Details
Closed on
May 21, 1999
Sold by
Emerine Richard W and Emerine Pamela D
Bought by
Emerine Richard W and Emerine Pamela D
Purchase Details
Closed on
Jul 17, 1996
Sold by
Centex Real Estate Corp
Bought by
Emerine Richard W and Emerine Pamela D
Home Financials for this Owner
Home Financials are based on the most recent Mortgage that was taken out on this home.
Original Mortgage
$183,410
Outstanding Balance
$13,355
Interest Rate
8.32%
Estimated Equity
$1,132,278
Create a Home Valuation Report for This Property
The Home Valuation Report is an in-depth analysis detailing your home's value as well as a comparison with similar homes in the area
Home Values in the Area
Average Home Value in this Area
Purchase History
| Date | Buyer | Sale Price | Title Company |
|---|---|---|---|
| Emerine Biccum Pamela D | -- | None Available | |
| Emerine Biccum Pamela D | -- | None Available | |
| Emerine Biccum Pamela D | -- | None Available | |
| Emerine Richard W | -- | -- | |
| Emerine Richard W | $229,500 | Continental Lawyers Title Co |
Source: Public Records
Mortgage History
| Date | Status | Borrower | Loan Amount |
|---|---|---|---|
| Open | Emerine Richard W | $183,410 |
Source: Public Records
Tax History
| Year | Tax Paid | Tax Assessment Tax Assessment Total Assessment is a certain percentage of the fair market value that is determined by local assessors to be the total taxable value of land and additions on the property. | Land | Improvement |
|---|---|---|---|---|
| 2025 | $4,427 | $402,690 | $70,020 | $332,670 |
| 2024 | $4,427 | $394,796 | $68,648 | $326,148 |
| 2023 | $4,398 | $387,055 | $67,302 | $319,753 |
| 2022 | $4,388 | $379,467 | $65,983 | $313,484 |
| 2021 | $4,294 | $372,028 | $64,690 | $307,338 |
| 2020 | $4,280 | $368,214 | $64,027 | $304,187 |
| 2019 | $4,219 | $360,995 | $62,772 | $298,223 |
| 2018 | $4,019 | $353,918 | $61,542 | $292,376 |
| 2017 | $70 | $346,980 | $60,336 | $286,644 |
| 2016 | $3,858 | $340,177 | $59,153 | $281,024 |
| 2015 | $3,844 | $335,068 | $58,265 | $276,803 |
| 2014 | $3,754 | $328,505 | $57,124 | $271,381 |
Source: Public Records
Map
Nearby Homes
- 5216 Palmera Dr
- 475 Taylor Dr
- 1216 Woodview Dr
- 1400 Darwin Dr
- 1852 Red Willow Way
- 1303 Darwin Dr
- 1376 Darwin Dr
- 1423 Mountain Meadow Dr
- 5259 Hubbert St
- 1413 Eastview Ct
- 1513 Powell Rd
- 1540 Highridge Dr
- 1523 Temple Heights Dr
- 1529 Temple Heights Dr
- 1572 Peacock Blvd
- 872 Oro Grande St
- 241 Richard Ct
- 5331 Mead St
- 1508 Laurelwood Way
- 1560 Via Botero
- 1422 Woodhaven Dr
- 1414 Woodhaven Dr
- 1426 Woodhaven Dr
- 1410 Woodhaven Dr
- 1415 Woodhaven Dr
- 1419 Woodhaven Dr
- 5002 Palmera Dr
- 1430 Woodhaven Dr
- 1406 Woodhaven Dr
- 5114 Palmera Dr
- 1423 Woodhaven Dr
- 1427 Woodhaven Dr
- 5006 Palmera Dr
- 1434 Woodhaven Dr
- 1402 Woodhaven Dr
- 1431 Woodhaven Dr
- 5118 Palmera Dr
- 5110 Palmera Dr
- 5082 Palmera Dr
- 5003 Palmera Dr
Your Personal Tour Guide
Ask me questions while you tour the home.