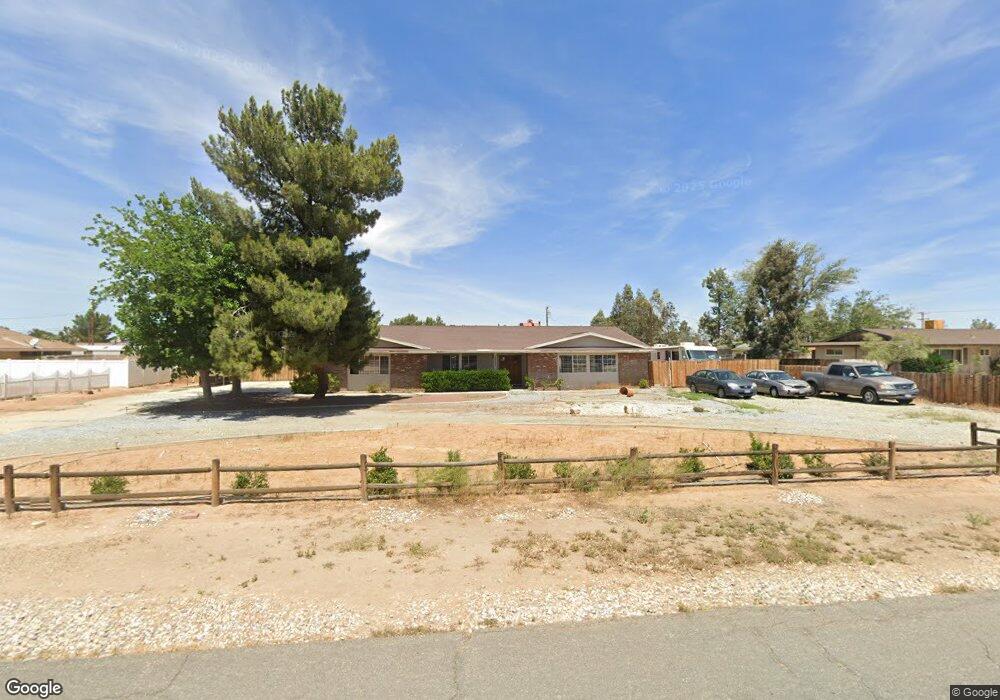
14180 Hopi Rd Apple Valley, CA 92307
High Desert NeighborhoodEstimated Value: $484,000 - $542,000
3
Beds
2
Baths
2,253
Sq Ft
$224/Sq Ft
Est. Value
About This Home
This home is located at 14180 Hopi Rd, Apple Valley, CA 92307 and is currently estimated at $503,591, approximately $223 per square foot. 14180 Hopi Rd is a home located in San Bernardino County with nearby schools including Rio Vista School of Applied Learning, Apple Valley High School, and Apple Valley Christian.
Ownership History
Date
Name
Owned For
Owner Type
Purchase Details
Closed on
Oct 22, 2003
Sold by
Phillip Amrod
Bought by
Phillip Amrod
Current Estimated Value
Home Financials for this Owner
Home Financials are based on the most recent Mortgage that was taken out on this home.
Original Mortgage
$159,000
Outstanding Balance
$71,695
Interest Rate
5.72%
Mortgage Type
Purchase Money Mortgage
Estimated Equity
$431,896
Purchase Details
Closed on
May 26, 1998
Sold by
Bankers Trust Company Of California Na
Bought by
Phillip Amrod
Home Financials for this Owner
Home Financials are based on the most recent Mortgage that was taken out on this home.
Original Mortgage
$100,000
Interest Rate
7.06%
Purchase Details
Closed on
Mar 6, 1997
Sold by
Mccarty Carolyn A
Bought by
Bankers Trust Company Of California Na and Structured Asset Securities Corp Mtg Pas
Create a Home Valuation Report for This Property
The Home Valuation Report is an in-depth analysis detailing your home's value as well as a comparison with similar homes in the area
Home Values in the Area
Average Home Value in this Area
Purchase History
| Date | Buyer | Sale Price | Title Company |
|---|---|---|---|
| Phillip Amrod | -- | American Title | |
| Phillip Amrod | $100,000 | Stewart Title | |
| Bankers Trust Company Of California Na | -- | Fidelity National Title Ins |
Source: Public Records
Mortgage History
| Date | Status | Borrower | Loan Amount |
|---|---|---|---|
| Open | Phillip Amrod | $159,000 | |
| Closed | Phillip Amrod | $100,000 |
Source: Public Records
Tax History Compared to Growth
Tax History
| Year | Tax Paid | Tax Assessment Tax Assessment Total Assessment is a certain percentage of the fair market value that is determined by local assessors to be the total taxable value of land and additions on the property. | Land | Improvement |
|---|---|---|---|---|
| 2025 | $1,857 | $156,773 | $31,353 | $125,420 |
| 2024 | $1,857 | $153,699 | $30,738 | $122,961 |
| 2023 | $1,840 | $150,685 | $30,135 | $120,550 |
| 2022 | $1,812 | $147,730 | $29,544 | $118,186 |
| 2021 | $1,771 | $144,834 | $28,965 | $115,869 |
| 2020 | $1,749 | $143,349 | $28,668 | $114,681 |
| 2019 | $1,717 | $140,538 | $28,106 | $112,432 |
| 2018 | $1,675 | $137,782 | $27,555 | $110,227 |
| 2017 | $1,651 | $135,081 | $27,015 | $108,066 |
| 2016 | $1,566 | $132,432 | $26,485 | $105,947 |
| 2015 | $1,542 | $130,443 | $26,087 | $104,356 |
| 2014 | $1,522 | $127,888 | $25,576 | $102,312 |
Source: Public Records
Map
Nearby Homes
- 14182 Gayhead Rd
- 20825 Rancherias Rd
- 13991 Jicarilla Rd
- 21160 Us Highway 18
- 20635 Tonawanda Rd
- 13901 Iroquois Rd
- 21235 Pine Ridge Ave
- 21265 Pine Ridge Ave
- 21130 Pine Ridge Ave
- 14490 Savannah Ct
- 21248 Rancherias Rd
- 21355 Pine Ridge Ave
- 14260 Chinook Rd
- 21431 Pine Ridge Ave
- 21408 Us Highway 18
- 14444 Iroquois Rd
- 20430 Rancherias Rd
- 20783 Shawnee Rd
- 13597 Kiowa Rd
- 64 California 18
- 14200 Hopi Rd
- 14170 Hopi Rd
- 14216 Hopi Rd
- 14154 Hopi Rd
- 14163 Hopi Rd
- 14175 Hopi Rd
- 14185 Hopi Rd
- 14249 Gayhead Rd
- 14275 Gayhead Rd
- 14151 Hopi Rd
- 14255 Gayhead Rd
- 14195 Hopi Rd
- 14285 Gayhead Rd
- 14136 Hopi Rd
- 14139 Hopi Rd
- 14225 Gayhead Rd
- 20965 Rancherias Rd
- 14205 Gayhead Rd
- 14125 Hopi Rd
- 20945 Rancherias Rd