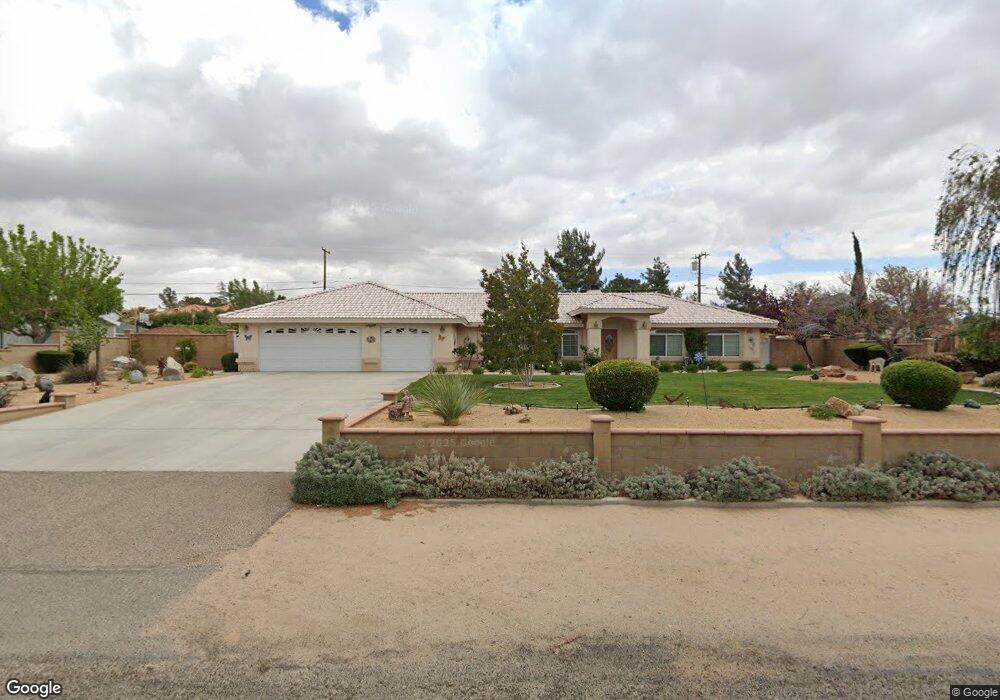
14185 Tehachapi Rd Apple Valley, CA 92307
High Desert NeighborhoodEstimated Value: $445,000 - $507,000
4
Beds
2
Baths
2,072
Sq Ft
$233/Sq Ft
Est. Value
About This Home
This home is located at 14185 Tehachapi Rd, Apple Valley, CA 92307 and is currently estimated at $481,971, approximately $232 per square foot. 14185 Tehachapi Rd is a home located in San Bernardino County with nearby schools including Rio Vista School of Applied Learning, Granite Hills High School, and Academy for Academic Excellence.
Ownership History
Date
Name
Owned For
Owner Type
Purchase Details
Closed on
Apr 3, 2014
Sold by
Peterson Leila R
Bought by
Peterson Leila R and The Leila R Peterson Trust
Current Estimated Value
Purchase Details
Closed on
Feb 21, 2011
Sold by
Hallett Darren S
Bought by
Peterson Leila R
Purchase Details
Closed on
Oct 25, 2007
Sold by
Grady Lynn E
Bought by
Hallett Darren S and Hallett Robin L
Purchase Details
Closed on
Sep 5, 2007
Sold by
Peterson Christopher E
Bought by
Grady Lynn E
Purchase Details
Closed on
Nov 17, 2003
Sold by
Schroeder James R
Bought by
Peterson Christopher E and Peterson Deanna L
Purchase Details
Closed on
Apr 11, 2003
Sold by
Schroeder Patricia
Bought by
Schroeder James R and Schroeder Patricia A
Purchase Details
Closed on
Jul 10, 2002
Sold by
Teague Elizabeth M
Bought by
Schroeder Patricia and Hart Heidi
Create a Home Valuation Report for This Property
The Home Valuation Report is an in-depth analysis detailing your home's value as well as a comparison with similar homes in the area
Home Values in the Area
Average Home Value in this Area
Purchase History
| Date | Buyer | Sale Price | Title Company |
|---|---|---|---|
| Peterson Leila R | -- | None Available | |
| Peterson Leila R | -- | None Available | |
| Hallett Darren S | $220,800 | None Available | |
| Grady Lynn E | $221,000 | Chicago Title Company | |
| Peterson Christopher E | $225,000 | Chicago Title Co | |
| Schroeder James R | -- | -- | |
| Schroeder Patricia | $30,000 | First American Title |
Source: Public Records
Tax History Compared to Growth
Tax History
| Year | Tax Paid | Tax Assessment Tax Assessment Total Assessment is a certain percentage of the fair market value that is determined by local assessors to be the total taxable value of land and additions on the property. | Land | Improvement |
|---|---|---|---|---|
| 2025 | $2,856 | $256,236 | $38,435 | $217,801 |
| 2024 | $2,856 | $251,211 | $37,681 | $213,530 |
| 2023 | $2,829 | $246,285 | $36,942 | $209,343 |
| 2022 | $2,785 | $241,456 | $36,218 | $205,238 |
| 2021 | $2,720 | $236,722 | $35,508 | $201,214 |
| 2020 | $2,686 | $234,295 | $35,144 | $199,151 |
| 2019 | $2,635 | $229,701 | $34,455 | $195,246 |
| 2018 | $2,569 | $225,197 | $33,779 | $191,418 |
| 2017 | $2,533 | $220,782 | $33,117 | $187,665 |
| 2016 | $2,430 | $216,453 | $32,468 | $183,985 |
| 2015 | $2,393 | $213,201 | $31,980 | $181,221 |
| 2014 | $2,360 | $209,025 | $31,354 | $177,671 |
Source: Public Records
Map
Nearby Homes
- 14118 Monte Verde Ave
- 19145 Shoshonee Rd
- 19446 Shoshonee Rd
- 13955 Cuyamaca Rd
- 19545 Oshkosh Ln
- 19391 Seneca Rd
- 14455 Havasu Rd
- 14405 Mandan Rd
- 13771 Wawona Rd
- 14610 Apple Valley Rd
- 0 Choco Rd Unit HD25163962
- 0 Choco Rd Unit HD25067276
- 0 Choco Rd Unit HD24105766
- 19385 Oneida Rd
- 19678 Red Feather Rd
- 19345 Oneida Rd
- 19804 Haida Rd
- 13724 Chateau Ct
- 13827 Olathe Rd
- 14287 Bochee Rd
- 14191 Tehachapi Rd
- 14177 Tehachapi Rd
- 14176 Apple Valley Rd
- 14188 Apple Valley Rd
- 14166 Apple Valley Rd
- 14180 Tehachapi Rd
- 14203 Tehachapi Rd
- 14171 Tehachapi Rd
- 14202 Apple Valley Rd
- 14170 Tehachapi Rd
- 14150 Apple Valley Rd
- 14204 Tehachapi Rd
- 14188 Cuyamaca Rd
- 14187 Cuyamaca Rd
- 19262 Shoshonee Rd
- 14161 Tehachapi Rd
- 19205 Haida Rd
- 14160 Tehachapi Rd
- 14183 Apple Valley Rd
- 14165 Apple Valley Rd