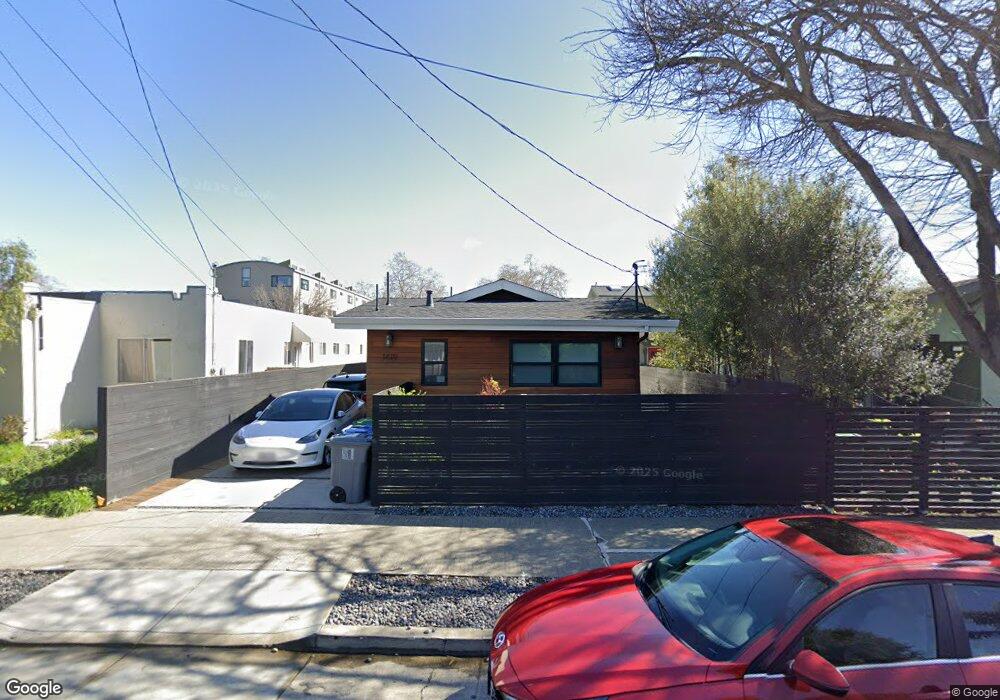
1419 10th St Berkeley, CA 94710
West Berkeley NeighborhoodEstimated Value: $1,760,000 - $2,182,659
4
Beds
4
Baths
1,830
Sq Ft
$1,079/Sq Ft
Est. Value
About This Home
This home is located at 1419 10th St, Berkeley, CA 94710 and is currently estimated at $1,975,165, approximately $1,079 per square foot. 1419 10th St is a home located in Alameda County with nearby schools including Ruth Acty Elementary, Rosa Parks Elementary School, and Berkeley Arts Magnet at Whittier School.
Ownership History
Date
Name
Owned For
Owner Type
Purchase Details
Closed on
Aug 19, 2019
Sold by
Rea Collective Llc
Bought by
Shankar Kuppe G and Shankar Shaku
Current Estimated Value
Purchase Details
Closed on
Mar 8, 2018
Sold by
Turtle Shell Llc
Bought by
Rea Collective Llc
Home Financials for this Owner
Home Financials are based on the most recent Mortgage that was taken out on this home.
Original Mortgage
$382,500
Interest Rate
4.15%
Mortgage Type
New Conventional
Purchase Details
Closed on
Jan 24, 2018
Sold by
Clemons Dina S and Clemons Aaron C
Bought by
Turtle Shell Llc
Home Financials for this Owner
Home Financials are based on the most recent Mortgage that was taken out on this home.
Original Mortgage
$382,500
Interest Rate
4.15%
Mortgage Type
New Conventional
Purchase Details
Closed on
Sep 8, 1995
Sold by
Clemons Charlie
Bought by
Clemons Charlie
Create a Home Valuation Report for This Property
The Home Valuation Report is an in-depth analysis detailing your home's value as well as a comparison with similar homes in the area
Home Values in the Area
Average Home Value in this Area
Purchase History
| Date | Buyer | Sale Price | Title Company |
|---|---|---|---|
| Shankar Kuppe G | $1,700,000 | Old Republic Title Company | |
| Rea Collective Llc | $845,000 | Old Republic Title Company | |
| Turtle Shell Llc | $578,000 | Old Republic Title Company | |
| Clemons Charlie | -- | -- |
Source: Public Records
Mortgage History
| Date | Status | Borrower | Loan Amount |
|---|---|---|---|
| Previous Owner | Rea Collective Llc | $382,500 | |
| Previous Owner | Turtle Shell Llc | $600,000 |
Source: Public Records
Tax History
| Year | Tax Paid | Tax Assessment Tax Assessment Total Assessment is a certain percentage of the fair market value that is determined by local assessors to be the total taxable value of land and additions on the property. | Land | Improvement |
|---|---|---|---|---|
| 2025 | $26,318 | $1,859,171 | $656,178 | $1,202,993 |
| 2024 | $26,318 | $1,822,723 | $643,314 | $1,179,409 |
| 2023 | $25,756 | $1,786,989 | $630,702 | $1,156,287 |
| 2022 | $25,529 | $1,751,952 | $618,336 | $1,133,616 |
| 2021 | $25,623 | $1,717,612 | $606,216 | $1,111,396 |
| 2020 | $24,496 | $1,700,000 | $600,000 | $1,100,000 |
| 2019 | $13,982 | $861,900 | $561,000 | $300,900 |
| 2018 | $4,042 | $134,743 | $52,505 | $82,238 |
| 2017 | $3,858 | $132,101 | $51,475 | $80,626 |
| 2016 | $3,679 | $129,511 | $50,466 | $79,045 |
| 2015 | $3,608 | $127,566 | $49,708 | $77,858 |
| 2014 | $3,545 | $125,069 | $48,735 | $76,334 |
Source: Public Records
Map
Nearby Homes
- 1339 Kains Ave
- 921 Jones St
- 1234 Stannage Ave
- 1213 San Pablo Ave
- 995 Virginia St
- 817 Jones St
- 1207 Cornell Ave
- 1631 Belvedere Ave
- 1450 Fourth St Unit 5
- 0 Camelia St Unit 41104882
- 1728 Curtis St
- 940 Delaware St
- 1114 Talbot Ave
- 1128 Delaware St
- 1050 Kains Ave Unit B1(3)
- 1322 Virginia St
- 817 Delaware St
- 1127 Key Route Blvd
- 1368 Rose St
- 1120 Curtis St
- 1423 10th St
- 1427 10th St
- 1429 Tenth St
- 1411 10th St
- 1407 10th St
- 1065 Page St
- 1053 Page St
- 1071 Page St
- 1051 Page St
- 1426 San Pablo Ave
- 1416 Tenth St
- 1406 San Pablo Ave Unit H
- 1406 San Pablo Ave Unit G
- 1406 San Pablo Ave Unit F
- 1406 San Pablo Ave Unit E
- 1406 San Pablo Ave Unit D
- 1406 San Pablo Ave Unit C
- 1406 San Pablo Ave Unit B
- 1406 San Pablo Ave Unit A
- 1034 Camelia St
Your Personal Tour Guide
Ask me questions while you tour the home.