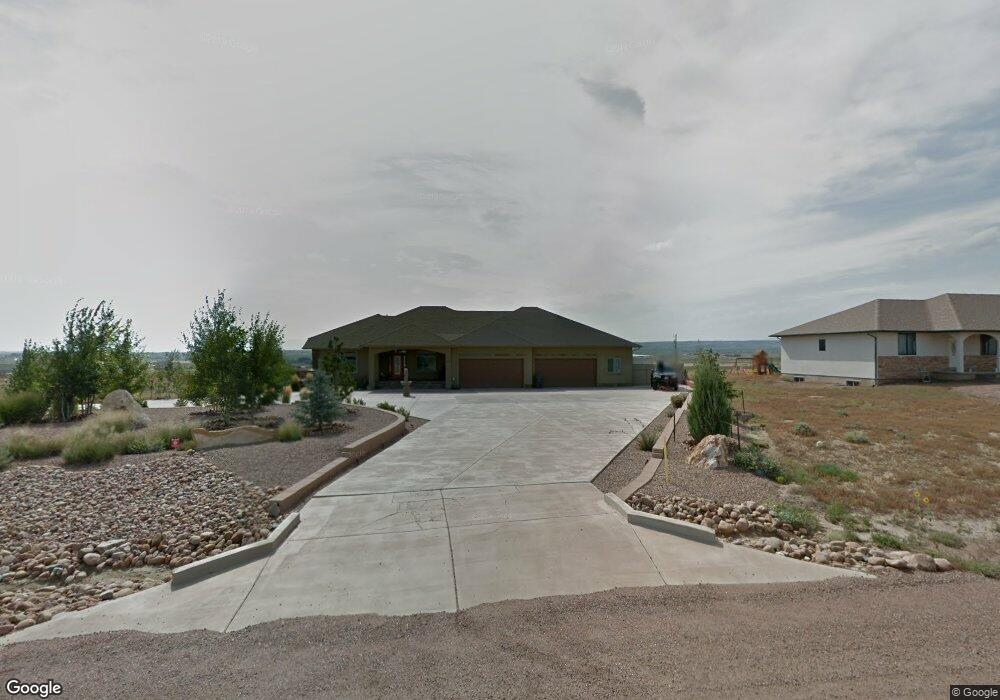
1419 N Will Rogers Dr Pueblo, CO 81007
Estimated Value: $597,000 - $727,454
3
Beds
4
Baths
2,231
Sq Ft
$305/Sq Ft
Est. Value
About This Home
This home is located at 1419 N Will Rogers Dr, Pueblo, CO 81007 and is currently estimated at $680,151, approximately $304 per square foot. 1419 N Will Rogers Dr is a home located in Pueblo County with nearby schools including Prairie Winds Elementary School, Liberty Point International School, and Pueblo West High School.
Ownership History
Date
Name
Owned For
Owner Type
Purchase Details
Closed on
Aug 31, 2010
Sold by
Hrabal Tanya L
Bought by
Hrabal Tanya L and Cox Douglas W
Current Estimated Value
Purchase Details
Closed on
Oct 8, 2009
Sold by
Hrabal Tanya L and Cox Douglas W
Bought by
Hrabal Tanya L
Purchase Details
Closed on
Jul 12, 2008
Sold by
Roberto Peter and Roberto Peter A
Bought by
Roberto Catherine
Purchase Details
Closed on
Jul 11, 2008
Sold by
Roberto Catherine
Bought by
Hrabal Tanya L and Cox Douglas W
Purchase Details
Closed on
Jul 1, 2008
Sold by
Profera Angela and Profera Roberto Angela
Bought by
Roberto Peter
Purchase Details
Closed on
Apr 25, 2007
Sold by
Roberto Peter
Bought by
Roberto Catherine
Purchase Details
Closed on
Apr 5, 2006
Sold by
Profera Angela
Bought by
Roberto Peter
Create a Home Valuation Report for This Property
The Home Valuation Report is an in-depth analysis detailing your home's value as well as a comparison with similar homes in the area
Home Values in the Area
Average Home Value in this Area
Purchase History
| Date | Buyer | Sale Price | Title Company |
|---|---|---|---|
| Hrabal Tanya L | -- | Springs Title Llc | |
| Hrabal Tanya L | -- | None Available | |
| Roberto Catherine | -- | Land Title Guarantee Company | |
| Hrabal Tanya L | $27,000 | Land Title Guarantee Company | |
| Roberto Peter | -- | None Available | |
| Roberto Catherine | -- | None Available | |
| Roberto Peter | -- | None Available |
Source: Public Records
Tax History Compared to Growth
Tax History
| Year | Tax Paid | Tax Assessment Tax Assessment Total Assessment is a certain percentage of the fair market value that is determined by local assessors to be the total taxable value of land and additions on the property. | Land | Improvement |
|---|---|---|---|---|
| 2024 | $4,320 | $49,700 | -- | -- |
| 2023 | $5,039 | $53,390 | $3,230 | $50,160 |
| 2022 | $4,068 | $40,540 | $2,100 | $38,440 |
| 2021 | $5,395 | $54,120 | $2,160 | $51,960 |
| 2020 | $6,704 | $54,350 | $2,390 | $51,960 |
| 2019 | $3,369 | $33,714 | $536 | $33,178 |
| 2018 | $3,007 | $30,073 | $504 | $29,569 |
| 2017 | $3,010 | $30,073 | $504 | $29,569 |
| 2016 | $2,844 | $28,458 | $637 | $27,821 |
| 2015 | $2,820 | $28,458 | $637 | $27,821 |
| 2014 | -- | $25,595 | $716 | $24,879 |
Source: Public Records
Map
Nearby Homes
- 1437 N Chuckwagon Ln
- 1436 N Chuckwagon Ln Unit 164 - PWNORTH
- 1352 N Blue Lake Ln
- 1384 N Blazing Star Ln
- 1327 N Blazing Star Ln
- 1494 E Purcell Blvd
- 1350 N Farley Dr
- 1267 N Ginger Ln
- 1326 N Farley Dr
- 1446 E Purcell Blvd
- 1434 E Purcell Blvd
- 1346 N Maverick Dr
- 1312 E Red Fox Ct
- 1343 N Maverick Dr
- 1239 N Rising Sun Place
- 1256 N Rising Sun Place
- 1205 N Picketwire Ln
- 1196 N Picketwire Ln
- 1265 N Starkweather Ln
- 1347 E Challenger Ave
- 1425 N Will Rogers Dr
- 1418 N Will Rogers Dr
- 1418 N Will Rogers Dr Unit 12
- 1431 N Will Rogers Dr Unit 28
- 1431 N Will Rogers Dr
- 1407 N Will Rogers Dr
- 1436 N Will Rogers Dr Unit 15
- 1437 N Will Rogers Dr Unit 27
- 1417 N Chuckwagon Ln Unit 33
- 1442 N Will Rogers Dr
- 1442 N Will Rogers Dr Unit 16
- 1390 N Will Rogers Dr Unit 11
- 1390 N Will Rogers Dr
- 1552 E Blue Mesa Ln Unit 11
- 1416 N Chuckwagon Ln Unit 39
- 1421 N Chuckwagon Ln
- 1449 N Will Rogers Dr
- 1449 N Will Rogers Dr Unit 25
- 1448 N Will Rogers Dr Unit 17
- 1404 N Chuckwagon Ln