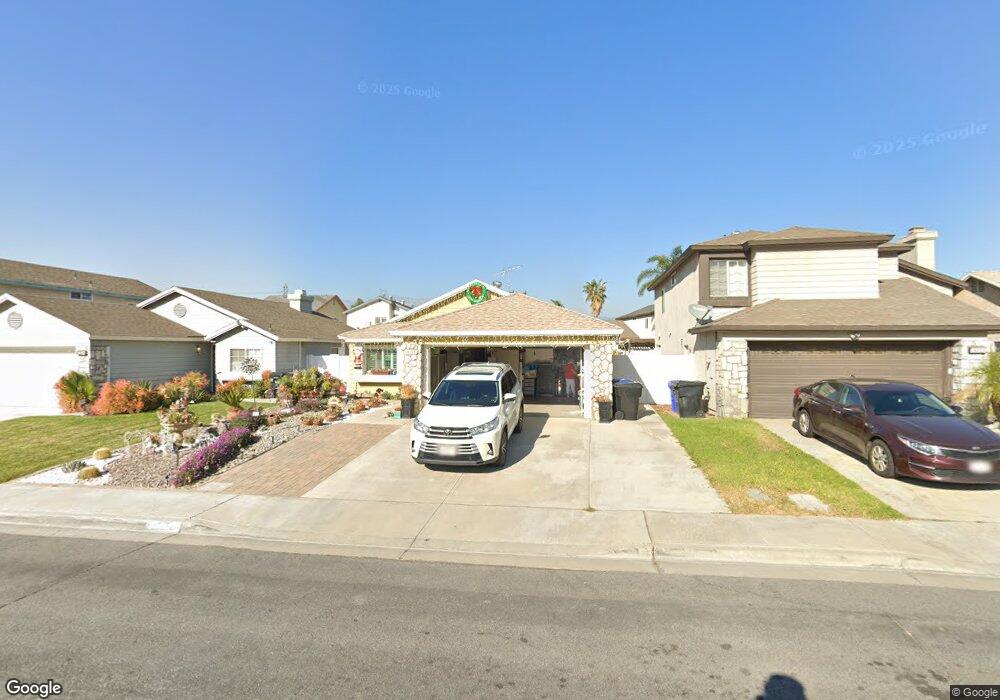
14198 Weeping Willow Ln Fontana, CA 92337
Southridge Village NeighborhoodEstimated Value: $555,000 - $575,000
3
Beds
2
Baths
1,109
Sq Ft
$509/Sq Ft
Est. Value
About This Home
This home is located at 14198 Weeping Willow Ln, Fontana, CA 92337 and is currently estimated at $564,403, approximately $508 per square foot. 14198 Weeping Willow Ln is a home located in San Bernardino County with nearby schools including Oak Park Elementary School, Southridge Middle School, and Henry J. Kaiser High School.
Ownership History
Date
Name
Owned For
Owner Type
Purchase Details
Closed on
Feb 6, 2015
Sold by
Pizarro Enzo J and Pizarro Veronica
Bought by
Pizarro Enzo J and Pizarro Veronica
Current Estimated Value
Home Financials for this Owner
Home Financials are based on the most recent Mortgage that was taken out on this home.
Original Mortgage
$212,000
Outstanding Balance
$161,775
Interest Rate
3.66%
Mortgage Type
New Conventional
Estimated Equity
$402,628
Purchase Details
Closed on
Oct 15, 1998
Sold by
Jimenez Beatriz C
Bought by
Pizarro Enzo J and Depizarro Veronica Torres
Home Financials for this Owner
Home Financials are based on the most recent Mortgage that was taken out on this home.
Original Mortgage
$110,205
Interest Rate
6.69%
Mortgage Type
FHA
Purchase Details
Closed on
Mar 29, 1994
Sold by
Ross Peter T and Ross Caren S
Bought by
Jimenez Beatriz C
Home Financials for this Owner
Home Financials are based on the most recent Mortgage that was taken out on this home.
Original Mortgage
$99,750
Interest Rate
7.79%
Create a Home Valuation Report for This Property
The Home Valuation Report is an in-depth analysis detailing your home's value as well as a comparison with similar homes in the area
Home Values in the Area
Average Home Value in this Area
Purchase History
| Date | Buyer | Sale Price | Title Company |
|---|---|---|---|
| Pizarro Enzo J | -- | Old Republic Title | |
| Pizarro Enzo J | $111,000 | Fidelity National Title Co | |
| Jimenez Beatriz C | $105,000 | Commonwealth Land Title Co |
Source: Public Records
Mortgage History
| Date | Status | Borrower | Loan Amount |
|---|---|---|---|
| Open | Pizarro Enzo J | $212,000 | |
| Previous Owner | Pizarro Enzo J | $110,205 | |
| Previous Owner | Jimenez Beatriz C | $99,750 |
Source: Public Records
Tax History Compared to Growth
Tax History
| Year | Tax Paid | Tax Assessment Tax Assessment Total Assessment is a certain percentage of the fair market value that is determined by local assessors to be the total taxable value of land and additions on the property. | Land | Improvement |
|---|---|---|---|---|
| 2025 | $3,484 | $174,018 | $43,582 | $130,436 |
| 2024 | $3,484 | $170,605 | $42,727 | $127,878 |
| 2023 | $3,390 | $167,260 | $41,889 | $125,371 |
| 2022 | $3,325 | $163,981 | $41,068 | $122,913 |
| 2021 | $3,262 | $160,766 | $40,263 | $120,503 |
| 2020 | $3,226 | $159,117 | $39,850 | $119,267 |
| 2019 | $3,153 | $155,997 | $39,069 | $116,928 |
| 2018 | $3,138 | $152,938 | $38,303 | $114,635 |
| 2017 | $3,087 | $149,939 | $37,552 | $112,387 |
| 2016 | $3,033 | $146,999 | $36,816 | $110,183 |
| 2015 | $2,970 | $144,791 | $36,263 | $108,528 |
| 2014 | $2,958 | $141,955 | $35,553 | $106,402 |
Source: Public Records
Map
Nearby Homes
- 14241 Elizabeth Ct
- 11919 Woodbridge Dr
- 12045 Glenheather Dr
- 14421 El Contento Ave
- 11840 Rustic Place
- 14213 Ranchero Dr
- 11820 Rustic Place
- 14018 Ridgewood Dr
- 14601 Long View Dr
- 13995 Ranchero Dr
- 14045 Parkwood Dr
- 11557 Oakwood Dr
- 3050 Cabana St
- 14791 Mountain High Dr
- 11431 Winery Dr
- 3087 Cabana St
- 3604 Campbell St
- Plan 2320 at Parkview - Canopy at Parkview
- Plan 2056 at Parkview - Canopy at Parkview
- Plan 1791 at Parkview - Canopy at Parkview
- 14202 Weeping Willow Ln
- 14192 Weeping Willow Ln
- 14208 Weeping Willow Ln
- 14186 Weeping Willow Ln
- 14199 Long View Dr
- 14191 Long View Dr
- 14201 Long View Dr
- 14187 Long View Dr
- 14178 Weeping Willow Ln
- 14201 Weeping Willow Ln
- 14195 Weeping Willow Ln
- 14209 Long View Dr
- 12078 Olivedale Dr
- 12072 Olivedale Dr
- 14207 Weeping Willow Ln
- 14187 Weeping Willow Ln
- 12064 Olivedale Dr
- 14170 Weeping Willow Ln
- 14213 Weeping Willow Ln
- 14181 Weeping Willow Ln