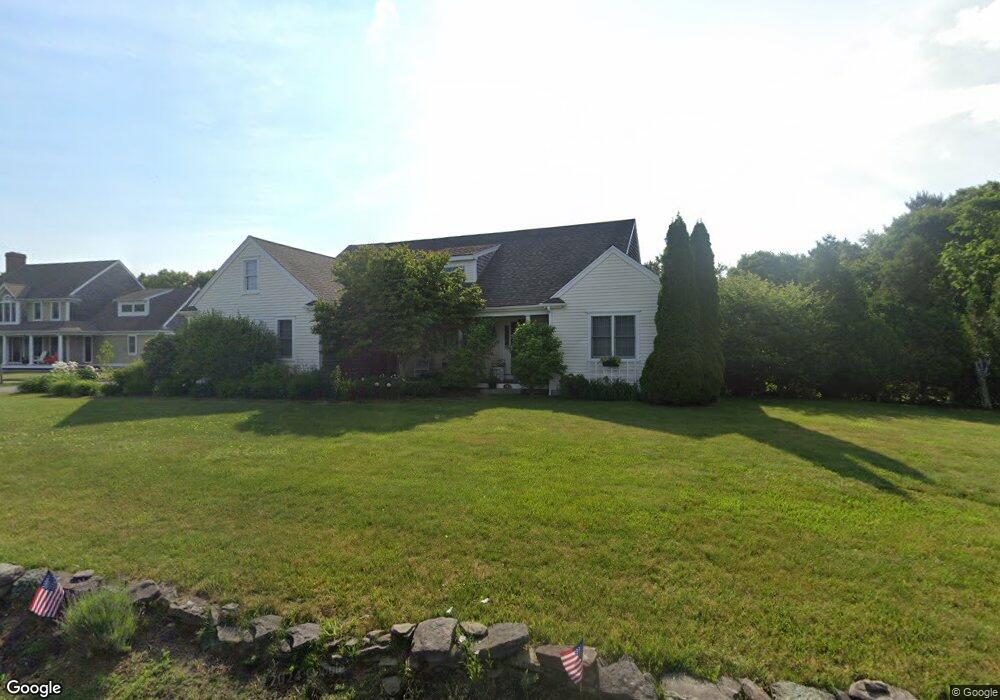
142 Bog Rd Marstons Mills, MA 02648
Marstons Mills NeighborhoodEstimated Value: $825,113 - $1,015,000
2
Beds
2
Baths
1,980
Sq Ft
$463/Sq Ft
Est. Value
About This Home
This home is located at 142 Bog Rd, Marstons Mills, MA 02648 and is currently estimated at $915,778, approximately $462 per square foot. 142 Bog Rd is a home located in Barnstable County with nearby schools including West Villages Elementary School, Barnstable United Elementary School, and Barnstable Intermediate School.
Ownership History
Date
Name
Owned For
Owner Type
Purchase Details
Closed on
Aug 9, 2016
Sold by
Larson Craig G and Larson Kim M
Bought by
Larson Kim M
Current Estimated Value
Purchase Details
Closed on
Oct 1, 2014
Sold by
Larson Craig G
Bought by
Larson Craig G
Purchase Details
Closed on
Dec 8, 2003
Sold by
Larson Realty Co Inc
Bought by
Larson Craig G
Home Financials for this Owner
Home Financials are based on the most recent Mortgage that was taken out on this home.
Original Mortgage
$100,000
Interest Rate
6.03%
Mortgage Type
Purchase Money Mortgage
Purchase Details
Closed on
Jan 15, 2003
Sold by
Manley Scott W
Bought by
Larson Realty Co Inc
Home Financials for this Owner
Home Financials are based on the most recent Mortgage that was taken out on this home.
Original Mortgage
$94,500
Interest Rate
6.18%
Mortgage Type
Purchase Money Mortgage
Create a Home Valuation Report for This Property
The Home Valuation Report is an in-depth analysis detailing your home's value as well as a comparison with similar homes in the area
Home Values in the Area
Average Home Value in this Area
Purchase History
| Date | Buyer | Sale Price | Title Company |
|---|---|---|---|
| Larson Kim M | -- | -- | |
| Larson Craig G | -- | -- | |
| Larson Craig G | $400,000 | -- | |
| Larson Realty Co Inc | $135,000 | -- | |
| Manley Scott W | $100,000 | -- |
Source: Public Records
Mortgage History
| Date | Status | Borrower | Loan Amount |
|---|---|---|---|
| Previous Owner | Manley Scott W | $100,000 | |
| Previous Owner | Manley Scott W | $94,500 |
Source: Public Records
Tax History
| Year | Tax Paid | Tax Assessment Tax Assessment Total Assessment is a certain percentage of the fair market value that is determined by local assessors to be the total taxable value of land and additions on the property. | Land | Improvement |
|---|---|---|---|---|
| 2025 | $6,778 | $837,800 | $176,400 | $661,400 |
| 2024 | $6,511 | $833,700 | $176,400 | $657,300 |
| 2023 | $6,072 | $728,000 | $160,400 | $567,600 |
| 2022 | $5,888 | $610,800 | $118,900 | $491,900 |
| 2021 | $5,510 | $525,300 | $118,900 | $406,400 |
| 2020 | $5,921 | $540,200 | $126,800 | $413,400 |
| 2019 | $5,596 | $496,100 | $126,800 | $369,300 |
| 2018 | $4,977 | $443,600 | $133,400 | $310,200 |
| 2017 | $4,616 | $429,000 | $133,400 | $295,600 |
| 2016 | $4,232 | $388,300 | $137,000 | $251,300 |
| 2015 | $3,857 | $355,500 | $127,100 | $228,400 |
Source: Public Records
Map
Nearby Homes
- 318 Old Mill Rd
- 315 Blackthorn Rd
- 152 Wakeby Rd
- 16 Newtown Rd
- 23 Middle Pond Path
- 19 Oriole Ln
- 2 Open Space Dr
- 6 George Gallant Rd
- 48 Holly Ridge Dr
- 82 Old Fields Rd
- 192 Sandy Valley Rd
- 78 Brittany Dr
- 32 Willington Ave
- 36 Moon Compass Ln
- 68 Hilltop Dr
- 24 Widow Coombs Walk
- 35 Santuit Pond Way Unit 7B
- 15 Geraldine Rd
- 113 Farmersville Rd
- 170 Forest Hills Rd
Your Personal Tour Guide
Ask me questions while you tour the home.