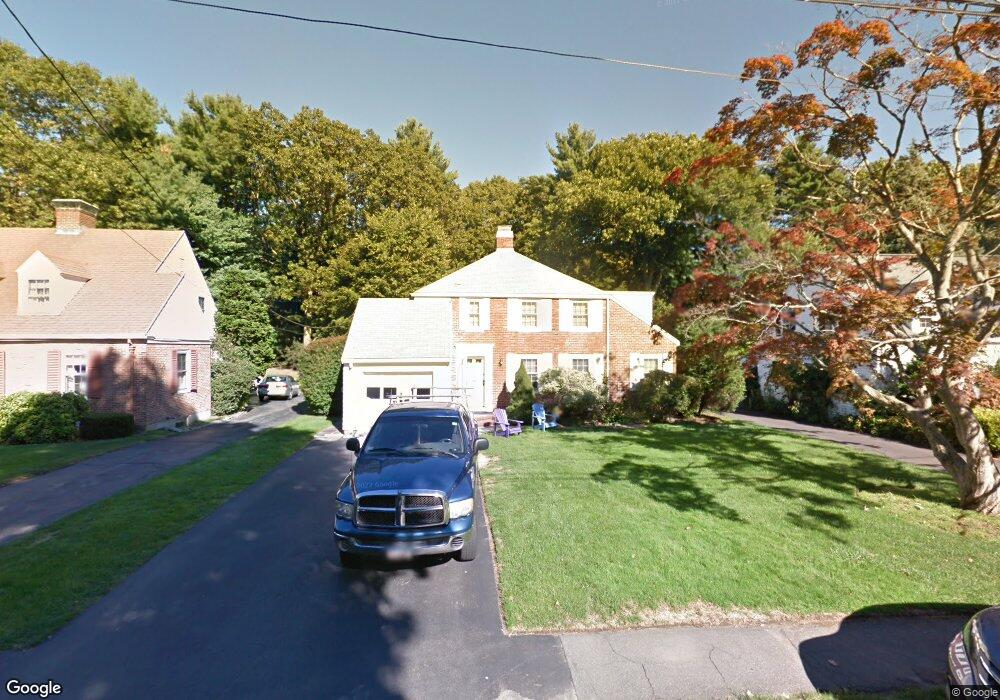
142 Manning St Needham Heights, MA 02494
Estimated Value: $1,331,000 - $1,496,000
3
Beds
3
Baths
1,516
Sq Ft
$917/Sq Ft
Est. Value
About This Home
This home is located at 142 Manning St, Needham Heights, MA 02494 and is currently estimated at $1,389,634, approximately $916 per square foot. 142 Manning St is a home located in Norfolk County with nearby schools including Mitchell Elementary School, High Rock Middle School, and Pollard Middle School.
Ownership History
Date
Name
Owned For
Owner Type
Purchase Details
Closed on
Jun 15, 1994
Sold by
Shawmut Bk
Bought by
Trebina Patricia
Current Estimated Value
Home Financials for this Owner
Home Financials are based on the most recent Mortgage that was taken out on this home.
Original Mortgage
$180,000
Interest Rate
8.5%
Mortgage Type
Purchase Money Mortgage
Create a Home Valuation Report for This Property
The Home Valuation Report is an in-depth analysis detailing your home's value as well as a comparison with similar homes in the area
Home Values in the Area
Average Home Value in this Area
Purchase History
| Date | Buyer | Sale Price | Title Company |
|---|---|---|---|
| Trebina Patricia | $291,500 | -- | |
| Trebina Patricia | $291,500 | -- |
Source: Public Records
Mortgage History
| Date | Status | Borrower | Loan Amount |
|---|---|---|---|
| Open | Trebina Patricia | $169,000 | |
| Closed | Trebina Patricia | $180,000 |
Source: Public Records
Tax History
| Year | Tax Paid | Tax Assessment Tax Assessment Total Assessment is a certain percentage of the fair market value that is determined by local assessors to be the total taxable value of land and additions on the property. | Land | Improvement |
|---|---|---|---|---|
| 2025 | $12,540 | $1,183,000 | $778,700 | $404,300 |
| 2024 | $12,628 | $1,008,600 | $556,100 | $452,500 |
| 2023 | $12,649 | $970,000 | $556,100 | $413,900 |
| 2022 | $11,848 | $886,200 | $488,300 | $397,900 |
| 2021 | $11,547 | $886,200 | $488,300 | $397,900 |
| 2020 | $11,331 | $907,200 | $488,300 | $418,900 |
| 2019 | $10,586 | $854,400 | $444,300 | $410,100 |
| 2018 | $10,150 | $854,400 | $444,300 | $410,100 |
| 2017 | $9,573 | $805,100 | $444,300 | $360,800 |
| 2016 | $9,291 | $805,100 | $444,300 | $360,800 |
| 2015 | $9,090 | $805,100 | $444,300 | $360,800 |
| 2014 | $8,662 | $744,200 | $404,300 | $339,900 |
Source: Public Records
Map
Nearby Homes
- 510 Webster St
- 11 Holmes St
- 55 Burnside Rd
- 638 Webster St
- 638 Webster St Unit 638
- 17 Lindbergh Ave
- 24 Mellen St
- 190 Brookline St
- 58 Morton St
- 674 Webster St
- 7 West St
- 28 Mercer Rd
- 19 Oakland Ave Unit 19
- 447 Hillside Ave
- 19 Highland Ct Unit 19
- 385 Hillside Ave
- 385 Hillside Ave Unit 385
- 100 Rosemary Way Unit 129
- 36 Otis St Unit 36
- 68 Brookline St
Your Personal Tour Guide
Ask me questions while you tour the home.