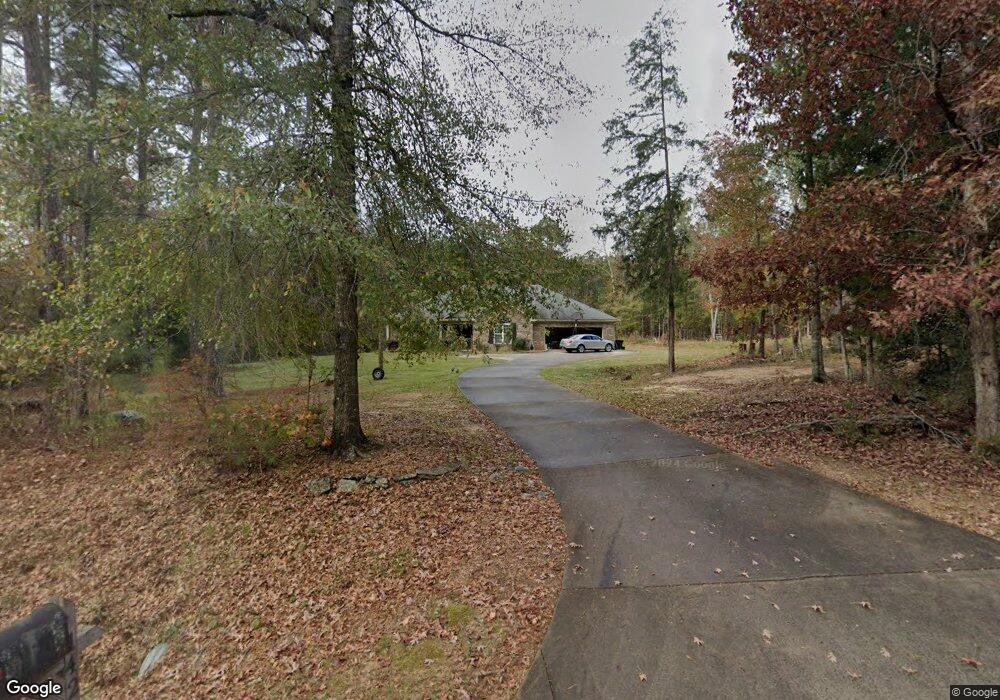
142 Maple Brook Ln Cataula, GA 31804
Cataula NeighborhoodEstimated Value: $334,708 - $413,000
4
Beds
2
Baths
2,332
Sq Ft
$158/Sq Ft
Est. Value
About This Home
This home is located at 142 Maple Brook Ln, Cataula, GA 31804 and is currently estimated at $369,177, approximately $158 per square foot. 142 Maple Brook Ln is a home with nearby schools including Mulberry Creek Elementary School, Creekside School, and Harris County Carver Middle School.
Ownership History
Date
Name
Owned For
Owner Type
Purchase Details
Closed on
Oct 29, 2015
Sold by
Hudson and Constructio Lucas Constructio
Bought by
Hunter James E
Current Estimated Value
Home Financials for this Owner
Home Financials are based on the most recent Mortgage that was taken out on this home.
Original Mortgage
$217,579
Outstanding Balance
$170,306
Interest Rate
3.89%
Mortgage Type
VA
Estimated Equity
$198,871
Purchase Details
Closed on
Feb 18, 2009
Sold by
J Holcomb Construction Inc
Bought by
Budson & Lucas Construction Llc
Home Financials for this Owner
Home Financials are based on the most recent Mortgage that was taken out on this home.
Original Mortgage
$208,500
Interest Rate
5.15%
Mortgage Type
New Conventional
Purchase Details
Closed on
Jul 12, 2005
Sold by
Ginn Stephen F and Roger Dale Mccain
Bought by
J Holcomb Construction Inc
Create a Home Valuation Report for This Property
The Home Valuation Report is an in-depth analysis detailing your home's value as well as a comparison with similar homes in the area
Home Values in the Area
Average Home Value in this Area
Purchase History
| Date | Buyer | Sale Price | Title Company |
|---|---|---|---|
| Hunter James E | $213,000 | -- | |
| Budson & Lucas Construction Llc | $45,000 | -- | |
| J Holcomb Construction Inc | $80,000 | -- |
Source: Public Records
Mortgage History
| Date | Status | Borrower | Loan Amount |
|---|---|---|---|
| Open | Hunter James E | $217,579 | |
| Previous Owner | Budson & Lucas Construction Llc | $208,500 |
Source: Public Records
Tax History
| Year | Tax Paid | Tax Assessment Tax Assessment Total Assessment is a certain percentage of the fair market value that is determined by local assessors to be the total taxable value of land and additions on the property. | Land | Improvement |
|---|---|---|---|---|
| 2025 | $149 | $113,850 | $20,000 | $93,850 |
| 2024 | $149 | $111,208 | $20,000 | $91,208 |
| 2023 | $150 | $111,408 | $20,000 | $91,408 |
| 2022 | $406 | $111,408 | $20,000 | $91,408 |
| 2021 | $149 | $100,040 | $20,000 | $80,040 |
| 2020 | $416 | $100,040 | $20,000 | $80,040 |
| 2019 | $532 | $100,040 | $20,000 | $80,040 |
| 2018 | $280 | $85,905 | $16,000 | $69,905 |
| 2017 | $2,379 | $85,905 | $16,000 | $69,905 |
| 2016 | $2,157 | $86,741 | $16,000 | $70,741 |
| 2015 | $2,390 | $90,544 | $16,000 | $74,544 |
| 2014 | $2,394 | $90,544 | $16,000 | $74,544 |
| 2013 | -- | $90,544 | $16,000 | $74,544 |
Source: Public Records
Map
Nearby Homes
- 111 E Bon Acre Rd
- 13145 Ga Highway 315
- 909 Red Fox Ct
- 492 Mulberry Crossing Dr
- 62 Foliage Ct
- 169 Cotton Ln
- 226.04 Ac Kingsboro Rd
- 218 E East Bonacre Rd
- 111 Shadewood Dr
- 262 Pintail Dr
- 141 Voorhees Rd
- 58 Sweetwater Dr
- 509 Sweetwater Dr
- 33 White Pine Dr
- 226.04+/-AC Kingsboro Rd
- 303 Rocky Springs Dr
- 508 Sweetwater Dr
- 239 Ossahatchie Dr
- 1278 Jones Rd
- 1578 Ga Highway 208
- 80 Maple Brook Ln
- 12686 Ga Highway 315
- 218 Maple Brook Ln
- 12700 Ga Highway 315
- 207 Maple Brook Ln
- 309 Maple Brook Ln
- 326 Maple Brook Ln
- 402 Maple Brook Ln
- 12858 Georgia 315
- 12714 Ga Highway 315
- 12858 Ga Highway 315
- 12858 Ga Highway 315 Unit 2
- 12736 Ga Highway 315
- 12714 Ga Highway 315
- 380 Maple Brook Ln
- 117 Maple Brook Ln
- 383 Maple Brook Ln
- 12822 Ga Highway 315
- 12855 Ga Highway 315
- 390 Maple Brook Ln
Your Personal Tour Guide
Ask me questions while you tour the home.