142 S K St Unit D Tulare, CA 93274
Estimated Value: $257,573
1
Bed
2
Baths
140
Sq Ft
$1,840/Sq Ft
Est. Value
About This Home
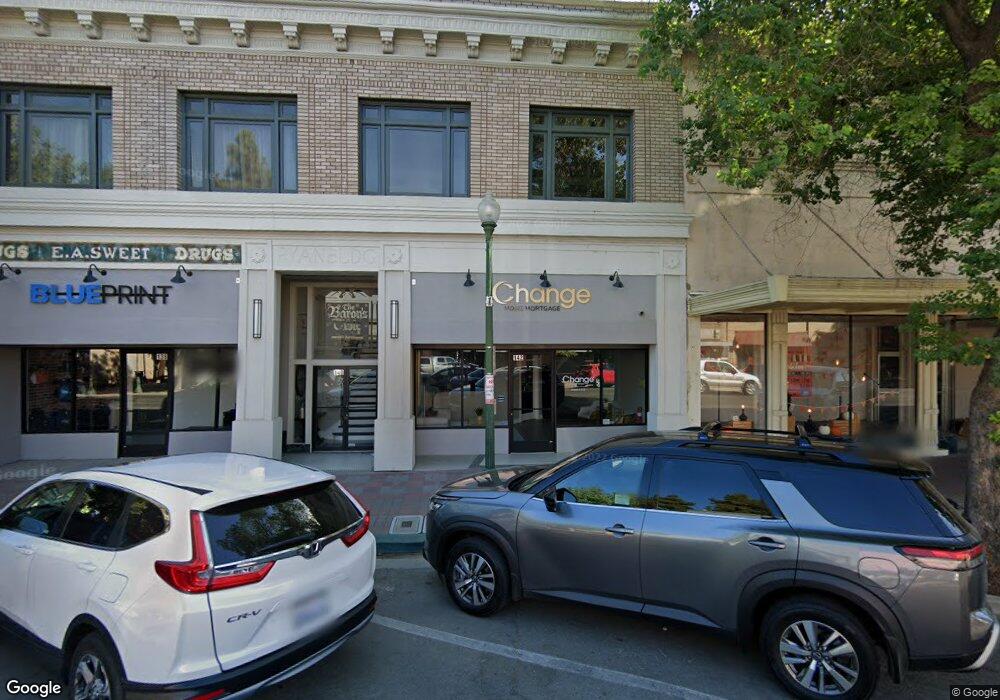
This home is located at 142 S K St Unit D, Tulare, CA 93274 and is currently estimated at $257,573, approximately $1,839 per square foot. 142 S K St Unit D is a home located in Tulare County with nearby schools including Wilson Elementary School, Cherry Avenue Middle School, and Tulare Union High School.
Ownership History
Date
Name
Owned For
Owner Type
Purchase Details
Closed on
Feb 28, 2018
Sold by
City Of Tulare
Bought by
Varo Real Investments Inc
Current Estimated Value
Purchase Details
Closed on
Aug 24, 2011
Sold by
Tulare Redevelopment Agency
Bought by
City Of Tulare
Purchase Details
Closed on
Mar 9, 2011
Sold by
Tulare Redevelopment Agency
Bought by
City Of Tulare
Purchase Details
Closed on
Oct 27, 2010
Sold by
Jefferson Mary Lou Ludwig
Bought by
Tulare Redevelopment Agency
Create a Home Valuation Report for This Property
The Home Valuation Report is an in-depth analysis detailing your home's value as well as a comparison with similar homes in the area
Home Values in the Area
Average Home Value in this Area
Purchase History
| Date | Buyer | Sale Price | Title Company |
|---|---|---|---|
| Varo Real Investments Inc | $180,000 | Chicagotitle Co | |
| City Of Tulare | -- | Chicago Title Co | |
| City Of Tulare | -- | None Available | |
| City Of Tulare | -- | None Available | |
| Tulare Redevelopment Agency | -- | Chicago Title Co |
Source: Public Records
Tax History
| Year | Tax Paid | Tax Assessment Tax Assessment Total Assessment is a certain percentage of the fair market value that is determined by local assessors to be the total taxable value of land and additions on the property. | Land | Improvement |
|---|---|---|---|---|
| 2025 | $2,229 | $204,806 | $68,268 | $136,538 |
| 2024 | $2,229 | $200,791 | $66,930 | $133,861 |
| 2023 | $2,172 | $196,855 | $65,618 | $131,237 |
| 2022 | $2,109 | $192,996 | $64,332 | $128,664 |
| 2021 | $2,082 | $189,212 | $63,071 | $126,141 |
| 2020 | $2,117 | $187,272 | $62,424 | $124,848 |
| 2019 | $2,170 | $183,600 | $61,200 | $122,400 |
| 2018 | $0 | $137,988 | $66,234 | $71,754 |
| 2017 | $0 | $135,282 | $64,935 | $70,347 |
| 2016 | -- | $132,630 | $63,662 | $68,968 |
| 2015 | -- | $130,638 | $62,706 | $67,932 |
| 2014 | -- | $128,079 | $61,478 | $66,601 |
Source: Public Records
Map
Nearby Homes
- 0 0 Unit CV26015491
- 202 N L St
- 257 N F St
- 815 E Sycamore Ave
- 348 N F St
- 861 E Sycamore Ave
- 234 S D St
- 560 N F St
- 129 S C St
- 707 W Sonora Ave
- 1072 E Sycamore Ave
- 908 N Beatrice Dr
- 947 W Kern Ave
- 320 N Blackstone St Unit 14
- 840 E Bardsley Ave
- 130 E Woodward Dr
- 1112 W San Joaquin Ave
- 1141 W San Joaquin Ave
- 560 W Pleasant Ave Unit 16
- 560 W Pleasant Ave Unit 75
Your Personal Tour Guide
Ask me questions while you tour the home.