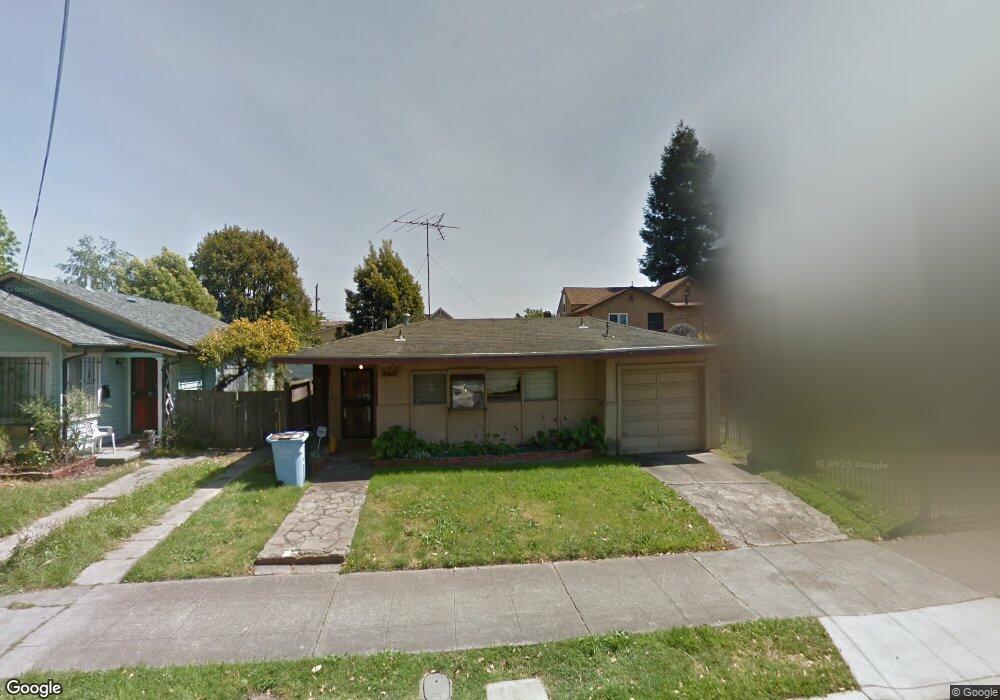
1420 66th St Berkeley, CA 94702
West Berkeley NeighborhoodEstimated Value: $911,125 - $1,136,000
3
Beds
1
Bath
1,241
Sq Ft
$821/Sq Ft
Est. Value
About This Home
This home is located at 1420 66th St, Berkeley, CA 94702 and is currently estimated at $1,018,531, approximately $820 per square foot. 1420 66th St is a home located in Alameda County with nearby schools including Malcolm X Elementary School, Washington Elementary School, and Oxford Elementary School.
Ownership History
Date
Name
Owned For
Owner Type
Purchase Details
Closed on
Mar 12, 2024
Sold by
Allen Eva Victoria
Bought by
Eva Allen Separate Property Trust and Allen
Current Estimated Value
Purchase Details
Closed on
Jan 26, 2021
Sold by
Allen Denise Bass
Bought by
Allen Eva Victoria
Purchase Details
Closed on
Nov 29, 2019
Sold by
Allen Denise B
Bought by
Allen Denise Bass and Denise Bass Allen Trust
Purchase Details
Closed on
May 11, 2012
Sold by
Bass Regina B
Bought by
Allen Denise B and The Bass Irrevocable Trust
Create a Home Valuation Report for This Property
The Home Valuation Report is an in-depth analysis detailing your home's value as well as a comparison with similar homes in the area
Home Values in the Area
Average Home Value in this Area
Purchase History
| Date | Buyer | Sale Price | Title Company |
|---|---|---|---|
| Eva Allen Separate Property Trust | -- | None Listed On Document | |
| Allen Eva Victoria | -- | None Available | |
| Allen Denise Bass | -- | None Available | |
| Allen Denise Bass | -- | None Available | |
| Allen Denise B | -- | None Available | |
| Allen Denise B | -- | None Available |
Source: Public Records
Tax History
| Year | Tax Paid | Tax Assessment Tax Assessment Total Assessment is a certain percentage of the fair market value that is determined by local assessors to be the total taxable value of land and additions on the property. | Land | Improvement |
|---|---|---|---|---|
| 2025 | $4,056 | $51,811 | $20,104 | $38,707 |
| 2024 | $4,056 | $50,658 | $19,710 | $37,948 |
| 2023 | $4,119 | $49,959 | $19,324 | $30,635 |
| 2022 | $3,056 | $41,980 | $18,945 | $30,035 |
| 2021 | $3,027 | $41,019 | $18,573 | $29,446 |
| 2020 | $2,792 | $47,527 | $18,383 | $29,144 |
| 2019 | $2,589 | $46,594 | $18,022 | $28,572 |
| 2018 | $2,505 | $45,681 | $17,669 | $28,012 |
| 2017 | $2,380 | $44,786 | $17,323 | $27,463 |
| 2016 | $2,219 | $43,908 | $16,983 | $26,925 |
| 2015 | $2,170 | $43,248 | $16,728 | $26,520 |
| 2014 | $2,114 | $42,401 | $16,400 | $26,001 |
Source: Public Records
Map
Nearby Homes
- 3101 Sacramento St
- 3224 Sacramento St
- 3138 California St
- 1507 Prince St
- 3114 California St
- 3110 California St
- 3214 California St
- 968 62nd St
- 1314 Ashby Ave
- 3032 Mabel St
- 1646 Ashby Ave
- 1535 Julia St
- 6628 Helen Ct
- 1080 67th St
- 3233 Ellis St
- 6500 San Pablo Ave
- 1237 Ashby Ave
- 6501 San Pablo Ave Unit 410
- 6465 San Pablo Ave Unit 203
- 2926 Ellis St
Your Personal Tour Guide
Ask me questions while you tour the home.