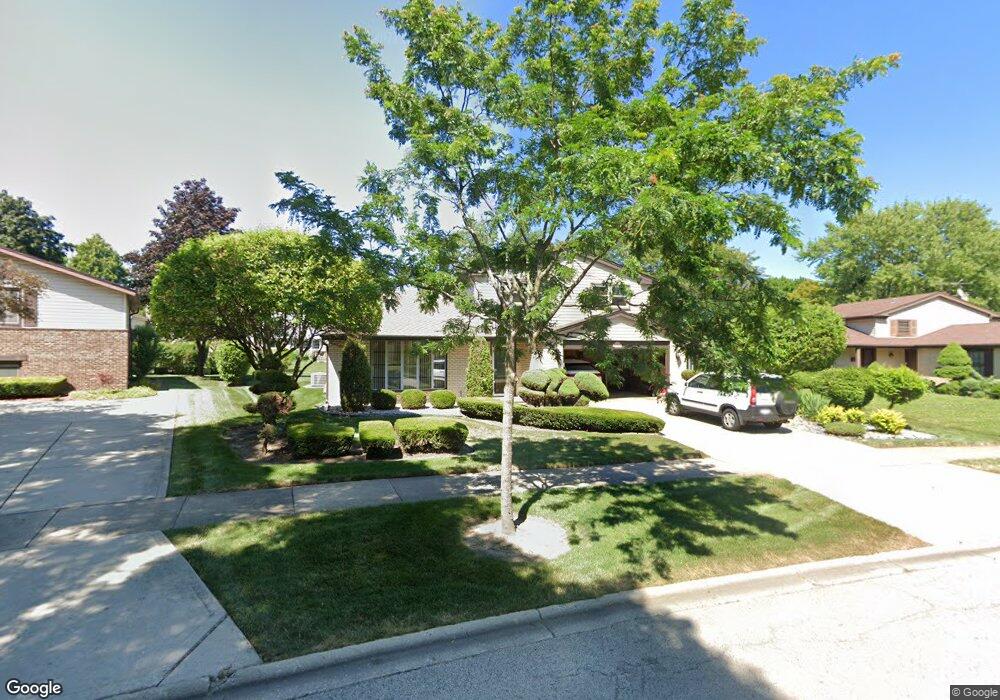
1420 E Best Dr Arlington Heights, IL 60004
Estimated Value: $460,000 - $549,000
3
Beds
3
Baths
1,390
Sq Ft
$366/Sq Ft
Est. Value
About This Home
This home is located at 1420 E Best Dr, Arlington Heights, IL 60004 and is currently estimated at $509,407, approximately $366 per square foot. 1420 E Best Dr is a home located in Cook County with nearby schools including J.W. Riley Elementary School, Jack London Middle School, and Buffalo Grove High School.
Ownership History
Date
Name
Owned For
Owner Type
Purchase Details
Closed on
Jul 21, 2011
Sold by
Yarbrough Robert J and Yarbrough Barbara J
Bought by
Yarbrough Barbara J and Barbara J Yarbrough Revocable Trust
Current Estimated Value
Create a Home Valuation Report for This Property
The Home Valuation Report is an in-depth analysis detailing your home's value as well as a comparison with similar homes in the area
Home Values in the Area
Average Home Value in this Area
Purchase History
| Date | Buyer | Sale Price | Title Company |
|---|---|---|---|
| Yarbrough Barbara J | -- | None Available |
Source: Public Records
Tax History Compared to Growth
Tax History
| Year | Tax Paid | Tax Assessment Tax Assessment Total Assessment is a certain percentage of the fair market value that is determined by local assessors to be the total taxable value of land and additions on the property. | Land | Improvement |
|---|---|---|---|---|
| 2024 | $9,831 | $33,564 | $9,475 | $24,089 |
| 2023 | $9,307 | $38,000 | $9,475 | $28,525 |
| 2022 | $9,307 | $38,000 | $9,475 | $28,525 |
| 2021 | $5,474 | $32,793 | $5,383 | $27,410 |
| 2020 | $4,963 | $32,793 | $5,383 | $27,410 |
| 2019 | $4,964 | $36,559 | $5,383 | $31,176 |
| 2018 | $9,456 | $35,359 | $4,737 | $30,622 |
| 2017 | $5,353 | $35,359 | $4,737 | $30,622 |
| 2016 | $5,959 | $35,359 | $4,737 | $30,622 |
| 2015 | $6,805 | $25,299 | $4,091 | $21,208 |
| 2014 | $7,015 | $26,734 | $4,091 | $22,643 |
| 2013 | $6,677 | $26,734 | $4,091 | $22,643 |
Source: Public Records
Map
Nearby Homes
- 1306 E Best Dr
- 3400 N Buffalo Grove Rd
- 159 University Dr
- 561 Park View Terrace Unit 153
- 1602 Chippewa Trail Unit 21201
- 3401 N Ellen Dr
- 3157 N Daniels Ct Unit 1502
- 3300 N Carriageway Dr Unit 317
- 2640 N Windsor Dr Unit 102
- 425 Commanche Trail Unit 3020
- 441 Commanche Trail Unit 3100
- 2632 N Windsor Dr Unit 104
- 2604 N Windsor Dr Unit 206
- 2604 N Windsor Dr Unit 307
- 200 Lake Blvd Unit 455
- 200 Lake Blvd Unit 439
- 200 Lake Blvd Unit 457
- 200 Lake Blvd Unit 452
- 2620 N Windsor Dr Unit 201
- 2620 N Windsor Dr Unit 204
- 1424 E Best Dr
- 1412 E Best Dr
- 1429 E Fleming Dr S
- 1433 E Fleming Dr S
- 1421 E Fleming Dr S
- 1503 E Fleming Dr S
- 1430 E Best Dr
- 1408 E Best Dr
- 1415 E Best Dr
- 1507 E Fleming Dr S
- 1423 E Best Dr
- 1415 E Fleming Dr S
- 1506 E Best Dr
- 1404 E Best Dr
- 1433 E Best Dr
- 1515 E Fleming Dr S
- 1339 E Best Dr
- 1418 E Fleming Dr S
- 1509 E Best Dr
- 1428 E Fleming Dr S