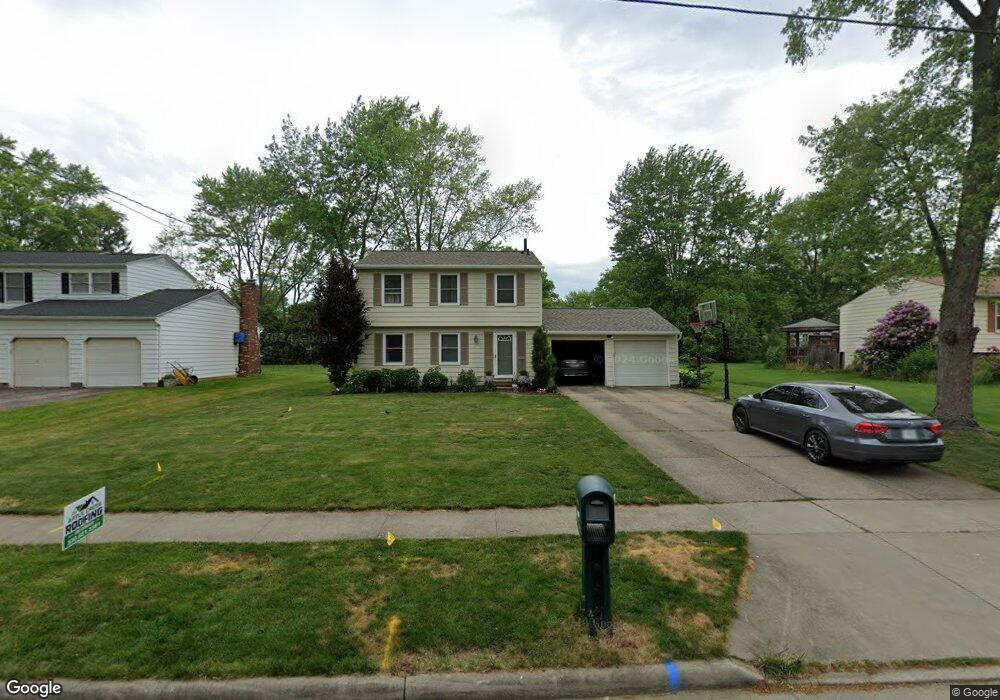
1420 Orchard View Dr Copley, OH 44321
Estimated Value: $231,116 - $257,000
4
Beds
2
Baths
1,300
Sq Ft
$185/Sq Ft
Est. Value
About This Home
This home is located at 1420 Orchard View Dr, Copley, OH 44321 and is currently estimated at $240,029, approximately $184 per square foot. 1420 Orchard View Dr is a home located in Summit County with nearby schools including Copley-Fairlawn Middle School, Copley High School, and Spring Garden Waldorf School.
Ownership History
Date
Name
Owned For
Owner Type
Purchase Details
Closed on
Aug 1, 2024
Sold by
Lanza Steven J
Bought by
Lanza Renee J
Current Estimated Value
Purchase Details
Closed on
Jul 26, 2024
Sold by
Lanza Steven J
Bought by
Lanza Renee J
Purchase Details
Closed on
Jul 23, 1999
Sold by
Brindle William Ernest
Bought by
Lanza Renee J and Lanza Steven J
Home Financials for this Owner
Home Financials are based on the most recent Mortgage that was taken out on this home.
Original Mortgage
$116,850
Interest Rate
7%
Purchase Details
Closed on
Oct 10, 1996
Sold by
Cross David
Bought by
Brindle William E
Home Financials for this Owner
Home Financials are based on the most recent Mortgage that was taken out on this home.
Original Mortgage
$100,000
Interest Rate
8.14%
Mortgage Type
Balloon
Create a Home Valuation Report for This Property
The Home Valuation Report is an in-depth analysis detailing your home's value as well as a comparison with similar homes in the area
Home Values in the Area
Average Home Value in this Area
Purchase History
| Date | Buyer | Sale Price | Title Company |
|---|---|---|---|
| Lanza Renee J | -- | None Listed On Document | |
| Lanza Renee J | -- | None Listed On Document | |
| Lanza Renee J | $123,000 | Bond & Associates Title Agen | |
| Brindle William E | $114,000 | -- |
Source: Public Records
Mortgage History
| Date | Status | Borrower | Loan Amount |
|---|---|---|---|
| Previous Owner | Lanza Renee J | $116,850 | |
| Previous Owner | Brindle William E | $100,000 |
Source: Public Records
Tax History
| Year | Tax Paid | Tax Assessment Tax Assessment Total Assessment is a certain percentage of the fair market value that is determined by local assessors to be the total taxable value of land and additions on the property. | Land | Improvement |
|---|---|---|---|---|
| 2025 | $3,636 | $65,405 | $13,745 | $51,660 |
| 2024 | $3,458 | $65,405 | $13,745 | $51,660 |
| 2023 | $3,458 | $65,405 | $13,745 | $51,660 |
| 2022 | $2,872 | $44,493 | $9,349 | $35,144 |
| 2021 | $2,649 | $44,493 | $9,349 | $35,144 |
| 2020 | $2,586 | $44,490 | $9,350 | $35,140 |
| 2019 | $2,638 | $40,930 | $9,160 | $31,770 |
| 2018 | $2,508 | $40,930 | $9,160 | $31,770 |
| 2017 | $2,612 | $40,930 | $9,160 | $31,770 |
| 2016 | $2,608 | $40,930 | $9,160 | $31,770 |
| 2015 | $2,612 | $40,930 | $9,160 | $31,770 |
| 2014 | $2,594 | $40,930 | $9,160 | $31,770 |
| 2013 | $2,681 | $42,920 | $9,160 | $33,760 |
Source: Public Records
Map
Nearby Homes
- 1423 Copley Meadows Dr
- 0 Aberth Dr
- 1329 Meadow Run
- 1161 Magdalyn Dr
- 1306 N Plainview Dr
- 2752 Copley Rd
- 1273 Meadow Run
- 1121 Meadow Run
- 1101 Meadow Run
- 1548 Sunside Dr
- 0 Schocalog Rd Unit 5155850
- 2950 Colon Dr
- 2973 Colon Dr
- 2941 Copley Rd
- 2799 Mull Ave Unit 10B
- 2773 Mull Ave
- 864 Kirkwall Dr Unit 47E
- 951 Kirkwall Dr
- 981 Kirkwall Dr Unit 27C
- 804 Stone Circle Dr
- 1426 Orchard View Dr
- 1410 Orchard View Dr
- 1434 Orchard View Dr
- 2534 Lawnshire Dr
- 2520 Lawnshire Dr
- 2544 Lawnshire Dr
- 2500 Lawnshire Dr
- 1400 Orchard View Dr
- 1417 Orchard View Dr
- 1425 Orchard View Dr
- 2552 Lawnshire Dr
- 1411 Orchard View Dr
- 1433 Orchard View Dr
- 1401 Orchard View Dr
- 2560 Lawnshire Dr
- 1448 Orchard View Dr
- 1441 Orchard View Dr
- 2568 Lawnshire Dr
- 2458 Lawnshire Dr
- 1447 Orchard View Dr
Your Personal Tour Guide
Ask me questions while you tour the home.