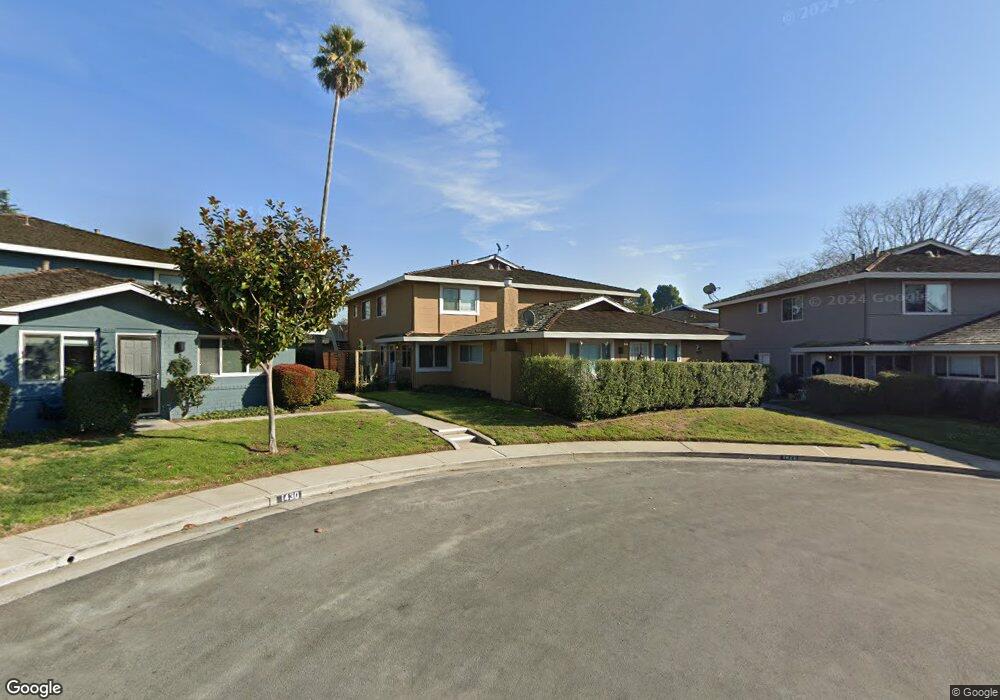
1420 Ruby Ct Unit 4 Capitola, CA 95010
Estimated Value: $657,155 - $685,000
2
Beds
1
Bath
925
Sq Ft
$725/Sq Ft
Est. Value
About This Home
This home is located at 1420 Ruby Ct Unit 4, Capitola, CA 95010 and is currently estimated at $670,789, approximately $725 per square foot. 1420 Ruby Ct Unit 4 is a home located in Santa Cruz County with nearby schools including Soquel Elementary School, New Brighton Middle School, and Mission Hill Middle School.
Ownership History
Date
Name
Owned For
Owner Type
Purchase Details
Closed on
Sep 9, 2021
Sold by
Tse Tat Chi
Bought by
Tse Tat Chi and Tse Kin Shing
Current Estimated Value
Purchase Details
Closed on
Jul 17, 2006
Sold by
Cook Francis E and The Cook Revocable Trust
Bought by
Tse Tat Chi and Jiang Wan Xi
Home Financials for this Owner
Home Financials are based on the most recent Mortgage that was taken out on this home.
Original Mortgage
$30,000
Interest Rate
6.57%
Mortgage Type
Credit Line Revolving
Purchase Details
Closed on
May 18, 2000
Sold by
Cook Francis E
Bought by
Cook Francis E
Purchase Details
Closed on
Nov 6, 1998
Sold by
Cook Marion K
Bought by
Cook Francis E
Create a Home Valuation Report for This Property
The Home Valuation Report is an in-depth analysis detailing your home's value as well as a comparison with similar homes in the area
Home Values in the Area
Average Home Value in this Area
Purchase History
| Date | Buyer | Sale Price | Title Company |
|---|---|---|---|
| Tse Tat Chi | -- | None Listed On Document | |
| Tse Tat Chi | $375,000 | Old Republic Title Company | |
| Cook Francis E | -- | -- | |
| Cook Francis E | -- | -- |
Source: Public Records
Mortgage History
| Date | Status | Borrower | Loan Amount |
|---|---|---|---|
| Previous Owner | Tse Tat Chi | $30,000 | |
| Previous Owner | Tse Tat Chi | $300,000 |
Source: Public Records
Tax History
| Year | Tax Paid | Tax Assessment Tax Assessment Total Assessment is a certain percentage of the fair market value that is determined by local assessors to be the total taxable value of land and additions on the property. | Land | Improvement |
|---|---|---|---|---|
| 2025 | $6,257 | $502,424 | $301,454 | $200,970 |
| 2024 | $6,257 | $492,570 | $295,542 | $197,028 |
| 2023 | $6,102 | $482,914 | $289,748 | $193,166 |
| 2022 | $6,015 | $473,444 | $284,066 | $189,378 |
| 2021 | $5,858 | $464,160 | $278,496 | $185,664 |
| 2020 | $5,785 | $459,402 | $275,642 | $183,760 |
| 2019 | $5,756 | $450,394 | $270,236 | $180,158 |
| 2018 | $5,652 | $441,564 | $264,938 | $176,626 |
| 2017 | $5,150 | $395,462 | $237,279 | $158,183 |
| 2016 | $4,562 | $359,511 | $215,708 | $143,803 |
| 2015 | $4,092 | $326,828 | $196,098 | $130,730 |
| 2014 | $3,726 | $294,439 | $176,664 | $117,775 |
Source: Public Records
Map
Nearby Homes
- 1420 Ruby Ct Unit 1
- 4435 Diamond St Unit 2
- 4160 Jade St Unit 103
- 4160 Jade St Unit 19
- 4160 Jade St Unit 90
- 4465 Diamond St Unit 4
- 4455 Jade St Unit 4
- 4475 Diamond St Unit 3
- 1771 44th Ave
- 1066 41st Ave Unit A303
- 1066 41st Ave Unit A207
- 1066 41st Ave Unit D106
- 4310 Nova Dr
- 1610 Bulb Ave
- 4750 Capitola Rd
- 750 47th Ave Unit 56
- 750 47th Ave Unit 69
- 750 47th Ave Unit 55
- 1040 38th Ave Unit 39
- 1040 38th Ave Unit 22
- 1420 Ruby Ct Unit 3
- 1420 Ruby Ct Unit 2
- 1430 Ruby Ct
- 1430 Ruby Ct Unit 4
- 1430 Ruby Ct Unit 3
- 1430 Ruby Ct Unit 2
- 1430 Ruby Ct Unit 1
- 1410 Ruby Ct Unit 4
- 1410 Ruby Ct Unit 3
- 1410 Ruby Ct Unit 2
- 1410 Ruby Ct Unit 1
- 1415 42nd Ave Unit 1
- 1415 42nd Ave Unit 4
- 1415 42nd Ave Unit 4
- 1415 42nd Ave Unit 3
- 1415 42nd Ave Unit 2
- 1415 42nd Ave Unit 1
- 1440 Ruby Ct Unit 4
- 1440 Ruby Ct Unit 3
- 1440 Ruby Ct Unit 2
Your Personal Tour Guide
Ask me questions while you tour the home.