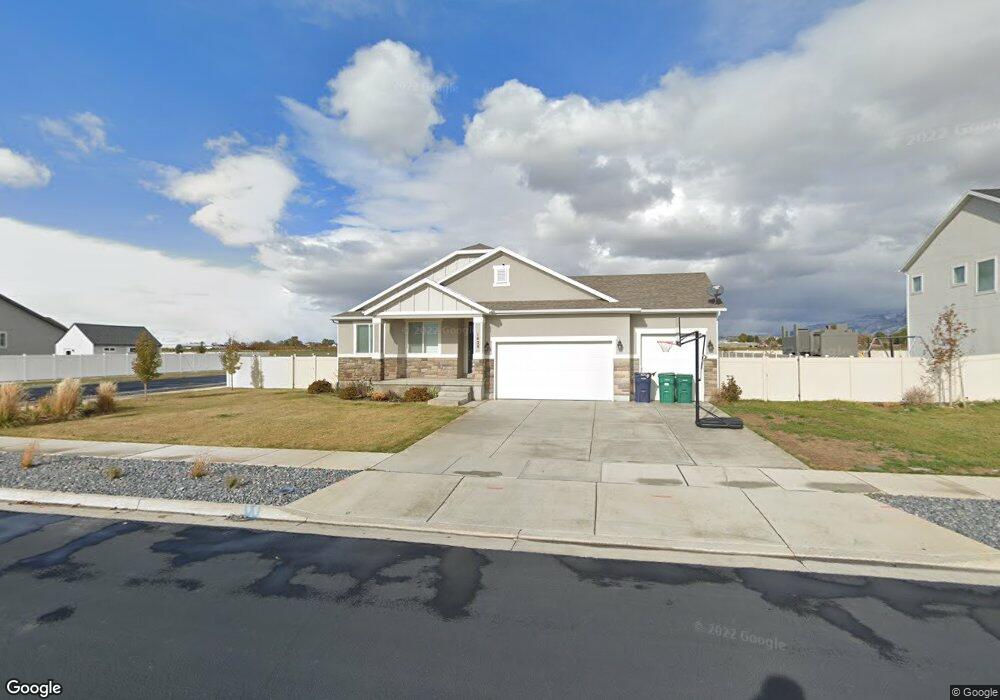
1420 W 425 S Unit 112 Layton, UT 84041
Estimated Value: $664,000 - $806,000
3
Beds
2
Baths
3,634
Sq Ft
$202/Sq Ft
Est. Value
About This Home
This home is located at 1420 W 425 S Unit 112, Layton, UT 84041 and is currently estimated at $734,078, approximately $202 per square foot. 1420 W 425 S Unit 112 is a home located in Davis County with nearby schools including Shoreline Junior High School, Layton High School, and North Davis Preparatory Academy.
Ownership History
Date
Name
Owned For
Owner Type
Purchase Details
Closed on
Oct 14, 2020
Sold by
Hortmann Sascha A
Bought by
Hortmann Sascha
Current Estimated Value
Home Financials for this Owner
Home Financials are based on the most recent Mortgage that was taken out on this home.
Original Mortgage
$356,250
Outstanding Balance
$316,148
Interest Rate
2.9%
Mortgage Type
New Conventional
Estimated Equity
$417,930
Purchase Details
Closed on
Dec 20, 2019
Sold by
Hortmann Sascha A and Hortman Sascha A
Bought by
Hortmann Sascha A
Home Financials for this Owner
Home Financials are based on the most recent Mortgage that was taken out on this home.
Original Mortgage
$40,000
Interest Rate
3.6%
Mortgage Type
Credit Line Revolving
Purchase Details
Closed on
Jun 20, 2018
Sold by
Alpine Homes Llc
Bought by
Hortman Sascha A
Home Financials for this Owner
Home Financials are based on the most recent Mortgage that was taken out on this home.
Original Mortgage
$396,671
Interest Rate
4.25%
Mortgage Type
FHA
Create a Home Valuation Report for This Property
The Home Valuation Report is an in-depth analysis detailing your home's value as well as a comparison with similar homes in the area
Home Values in the Area
Average Home Value in this Area
Purchase History
| Date | Buyer | Sale Price | Title Company |
|---|---|---|---|
| Hortmann Sascha | -- | Gateway Title Ins Agency | |
| Hortmann Sascha A | -- | First American Title | |
| Hortman Sascha A | -- | First American Title |
Source: Public Records
Mortgage History
| Date | Status | Borrower | Loan Amount |
|---|---|---|---|
| Open | Hortmann Sascha | $356,250 | |
| Closed | Hortmann Sascha A | $40,000 | |
| Closed | Hortman Sascha A | $396,671 |
Source: Public Records
Tax History Compared to Growth
Tax History
| Year | Tax Paid | Tax Assessment Tax Assessment Total Assessment is a certain percentage of the fair market value that is determined by local assessors to be the total taxable value of land and additions on the property. | Land | Improvement |
|---|---|---|---|---|
| 2025 | $3,254 | $341,551 | $130,202 | $211,349 |
| 2024 | $3,126 | $330,550 | $138,419 | $192,131 |
| 2023 | $3,010 | $561,000 | $148,423 | $412,577 |
| 2022 | $3,489 | $353,100 | $85,116 | $267,984 |
| 2021 | $3,279 | $495,000 | $127,646 | $367,354 |
| 2020 | $2,976 | $431,000 | $109,416 | $321,584 |
| 2019 | $2,940 | $417,000 | $107,299 | $309,701 |
| 2018 | $1,209 | $94,651 | $94,651 | $0 |
Source: Public Records
Map
Nearby Homes
- 557 S Angel St
- 1015 W 350 S
- 796 S Rock Creek Corner
- 296 S 950 W
- 362 S 950 W
- 583 S Alberta Spruce Dr
- 562 S 850 W
- 933 W Gentile St
- 37 N Swift Creek Dr
- 1606 W 200 N
- 163 Cold Creek Way
- 1042 W Shoreline Dr
- Browning Plan at Amber Fields
- Rhapsody Plan at Amber Fields
- Accord Plan at Amber Fields
- Timpani Plan at Amber Fields
- Octave Plan at Amber Fields
- Tempo Plan at Amber Fields
- Harvard Plan at Amber Fields
- Fortissimo Plan at Amber Fields
- 1402 W 425 S
- 1452 W 425 S Unit 220
- 1419 W 425 S Unit 111
- 1384 W 425 S Unit 114
- 1399 W 425 S Unit 110
- 1453 W 425 S Unit 201
- 1468 W 425 S Unit 219
- 1381 W 425 S Unit 109
- 1364 W 425 S Unit 115
- 1471 W 425 S Unit 202
- 1418 W 500 S
- 1396 W 500 S
- 1363 W 425 S Unit 108
- 1440 W 500 S
- 1440 W 500 S Unit 147
- 1492 W 425 S
- 1376 W 500 S Unit 107
- 1346 W 425 S
- 1420 W 50 N
- 1491 W 425 S Unit 203