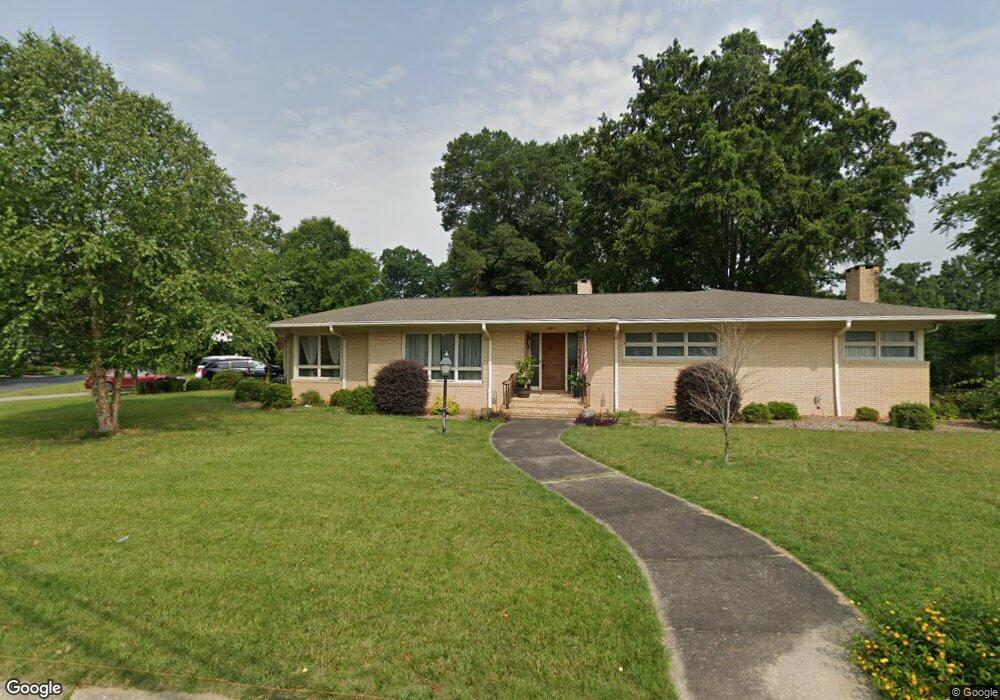
1420 W Main St Albemarle, NC 28001
Estimated Value: $369,000 - $506,000
4
Beds
4
Baths
4,402
Sq Ft
$96/Sq Ft
Est. Value
About This Home
This home is located at 1420 W Main St, Albemarle, NC 28001 and is currently estimated at $420,588, approximately $95 per square foot. 1420 W Main St is a home located in Stanly County with nearby schools including Central Elementary School, Albemarle Middle School, and Albemarle High School.
Ownership History
Date
Name
Owned For
Owner Type
Purchase Details
Closed on
Nov 7, 2014
Sold by
Hudson Bruce E
Bought by
Woodward Marco James and Woodward Doris E
Current Estimated Value
Home Financials for this Owner
Home Financials are based on the most recent Mortgage that was taken out on this home.
Original Mortgage
$202,268
Outstanding Balance
$152,035
Interest Rate
3.5%
Mortgage Type
FHA
Estimated Equity
$268,553
Purchase Details
Closed on
Oct 19, 2012
Sold by
Hudson Jenell and Hudson Steve Howard
Bought by
Ellen Loren Hudson Holweg Trust and Hudson Bruce E
Purchase Details
Closed on
Jul 2, 2012
Sold by
Hudson Bruce E and Hudson Cheryl H
Bought by
Hudson Jenell and Hudson Steve Howard
Purchase Details
Closed on
May 24, 2011
Sold by
Hudson Bruce E and Hudson Cheryl H
Bought by
Hudson Bruce E and Hudson Steve H
Create a Home Valuation Report for This Property
The Home Valuation Report is an in-depth analysis detailing your home's value as well as a comparison with similar homes in the area
Home Values in the Area
Average Home Value in this Area
Purchase History
| Date | Buyer | Sale Price | Title Company |
|---|---|---|---|
| Woodward Marco James | $206,000 | None Available | |
| Ellen Loren Hudson Holweg Trust | -- | None Available | |
| Hudson Jenell | -- | None Available | |
| Hudson Bruce E | -- | None Available | |
| Hudson Billy Joe | -- | None Available | |
| Hudson Billy Joe | -- | None Available |
Source: Public Records
Mortgage History
| Date | Status | Borrower | Loan Amount |
|---|---|---|---|
| Open | Woodward Marco James | $202,268 |
Source: Public Records
Tax History Compared to Growth
Tax History
| Year | Tax Paid | Tax Assessment Tax Assessment Total Assessment is a certain percentage of the fair market value that is determined by local assessors to be the total taxable value of land and additions on the property. | Land | Improvement |
|---|---|---|---|---|
| 2025 | $3,612 | $322,532 | $31,338 | $291,194 |
| 2024 | $2,754 | $225,770 | $16,714 | $209,056 |
| 2023 | $2,754 | $225,770 | $16,714 | $209,056 |
| 2022 | $2,754 | $225,770 | $16,714 | $209,056 |
| 2021 | $2,754 | $225,770 | $16,714 | $209,056 |
| 2020 | $2,295 | $176,936 | $14,206 | $162,730 |
| 2019 | $2,318 | $176,936 | $14,206 | $162,730 |
| 2018 | $2,318 | $176,936 | $14,206 | $162,730 |
| 2017 | $2,229 | $176,936 | $14,206 | $162,730 |
| 2016 | $2,289 | $181,674 | $12,535 | $169,139 |
| 2015 | $2,312 | $181,674 | $12,535 | $169,139 |
| 2014 | $2,068 | $160,969 | $12,535 | $148,434 |
Source: Public Records
Map
Nearby Homes
- 1610 Lowder St
- 1806 Kingsley Dr
- 1723 Lowder St
- 1724 Lowder St
- 406 Church St
- 1600 Bluff St
- 203 N Broome St
- 620 Central Ave
- 623 Coble Ave
- 715 Wood St
- 1119 Poplar St
- 2012 Crown Point Dr
- 710 Austin St Unit 124
- 00 NE Connector Bypass
- 2608 Parkwest Dr
- 63 Calle de Castello Unit 6
- 2100 Hillcrest Ave
- 0 Nc Hwy 24 27 Hwy
- 1316 Wiscassett St
- 2124 W Main St Unit C
- 1416 White Oak Ave
- 1410 W Main St
- 000 Lay St
- 1423 W Main St
- 1420 White Oak Ave
- 1435 Kingsley Dr
- 1426 W Main St
- 1433 W Main St Unit 92 & Pt94
- 1433 W Main St
- 1419 W Main St
- 1413 W Main St
- 1409 W Main St
- 1437 W Main St
- 1426 White Oak Ave
- 1414/1416 Kingsley Dr
- 1412 Kingsley Dr
- 200 Stonewall St
- 1429 White Oak Ave
- 1422 Kingsley Dr
- 1412 W Park Ave