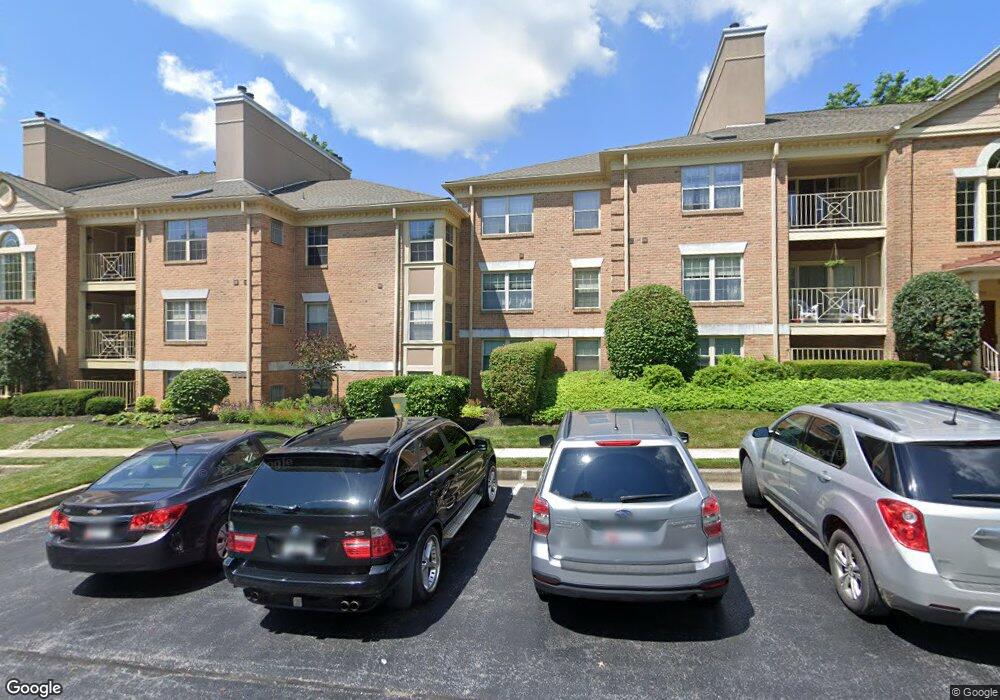
14206 Dove Creek Way Unit 202 Sparks Glencoe, MD 21152
Estimated Value: $258,484 - $275,000
--
Bed
--
Bath
1,165
Sq Ft
$228/Sq Ft
Est. Value
About This Home
This home is located at 14206 Dove Creek Way Unit 202, Sparks Glencoe, MD 21152 and is currently estimated at $266,121, approximately $228 per square foot. 14206 Dove Creek Way Unit 202 is a home located in Baltimore County with nearby schools including Sparks Elementary School, Hereford Middle School, and Hereford High School.
Ownership History
Date
Name
Owned For
Owner Type
Purchase Details
Closed on
Oct 15, 2015
Sold by
Brennan John M
Bought by
Bell Sonia E
Current Estimated Value
Home Financials for this Owner
Home Financials are based on the most recent Mortgage that was taken out on this home.
Original Mortgage
$142,000
Outstanding Balance
$111,876
Interest Rate
3.92%
Mortgage Type
New Conventional
Estimated Equity
$154,245
Purchase Details
Closed on
Mar 2, 2015
Sold by
Sundius Mary Jane and Brennan John M
Bought by
Brennan John M
Purchase Details
Closed on
Aug 3, 2004
Sold by
Hambrick Stowe Anne P
Bought by
Brennan John M and Sundius Mary Jane
Purchase Details
Closed on
Oct 24, 2002
Sold by
Miller Edward M
Bought by
Hambrick Stowe Anne P
Purchase Details
Closed on
Jan 22, 1997
Sold by
Miller Edward M
Bought by
Miller Edward M and Miller Karen K
Create a Home Valuation Report for This Property
The Home Valuation Report is an in-depth analysis detailing your home's value as well as a comparison with similar homes in the area
Home Values in the Area
Average Home Value in this Area
Purchase History
| Date | Buyer | Sale Price | Title Company |
|---|---|---|---|
| Bell Sonia E | $177,500 | Fidelity Natl Title Ins Co | |
| Brennan John M | -- | None Available | |
| Brennan John M | $165,350 | -- | |
| Brennan John M | $165,350 | -- | |
| Hambrick Stowe Anne P | $140,000 | -- | |
| Miller Edward M | -- | -- |
Source: Public Records
Mortgage History
| Date | Status | Borrower | Loan Amount |
|---|---|---|---|
| Open | Bell Sonia E | $142,000 |
Source: Public Records
Tax History Compared to Growth
Tax History
| Year | Tax Paid | Tax Assessment Tax Assessment Total Assessment is a certain percentage of the fair market value that is determined by local assessors to be the total taxable value of land and additions on the property. | Land | Improvement |
|---|---|---|---|---|
| 2025 | $3,614 | $210,000 | $60,000 | $150,000 |
| 2024 | $3,614 | $202,333 | $0 | $0 |
| 2023 | $1,742 | $194,667 | $0 | $0 |
| 2022 | $3,327 | $187,000 | $60,000 | $127,000 |
| 2021 | $3,023 | $184,667 | $0 | $0 |
| 2020 | $2,210 | $182,333 | $0 | $0 |
| 2019 | $2,182 | $180,000 | $60,000 | $120,000 |
| 2018 | $3,071 | $173,333 | $0 | $0 |
| 2017 | $2,758 | $166,667 | $0 | $0 |
| 2016 | $2,684 | $160,000 | $0 | $0 |
| 2015 | $2,684 | $160,000 | $0 | $0 |
| 2014 | $2,684 | $160,000 | $0 | $0 |
Source: Public Records
Map
Nearby Homes
- 146 English Run Cir
- 6 Rainflower Path Unit 304
- 46 Loveton Farms Ct
- 16 Meadow Run Ct
- 11 Old Forge Garth
- 58 Far Corners Loop
- 40 White Pine Ct
- 912 Hidden Moss Dr
- 13844 Ridgeview Ct
- 13840 Ridgeview Ct
- 13842 Ridgeview Ct
- 13838 Ridgeview Ct
- 13832 Ridgeview Ct
- 13826 Ridgeview Ct
- 13824 Ridgeview Ct
- 13820 Ridgeview Ct
- 13818 Ridgeview Ct
- 13812 Ridgeview Ct
- 244 Hickory Hollow Ct
- 13806 Ridgeview Ct
- 14206 Dove Creek Way Unit 204
- 14204 Dove Creek Way Unit 105
- 14206 Dove Creek Way Unit 303
- 14204 Dove Creek Way Unit 308
- 14204 Dove Creek Way Unit 207
- 14204 Dove Creek Way Unit 107
- 14206 Dove Creek Way Unit 103
- 14206 Dove Creek Way Unit 104
- 14206 Dove Creek Way Unit 302
- 14206 Dove Creek Way Unit 102
- 14206 Dove Creek Way Unit 304
- 14206 Dove Creek Way Unit 201
- 14206 Dove Creek Way Unit 301
- 14206 Dove Creek Way Unit 203
- 14204 Dove Creek Way Unit 306
- 14204 Dove Creek Way Unit 305
- 14204 Dove Creek Way Unit 205
- 14204 Dove Creek Way Unit 108
- 14204 Dove Creek Way Unit 106
- 14206 Dove Creek Way Unit 101