Estimated Value: $454,000 - $536,000
4
Beds
3
Baths
2,248
Sq Ft
$215/Sq Ft
Est. Value
About This Home
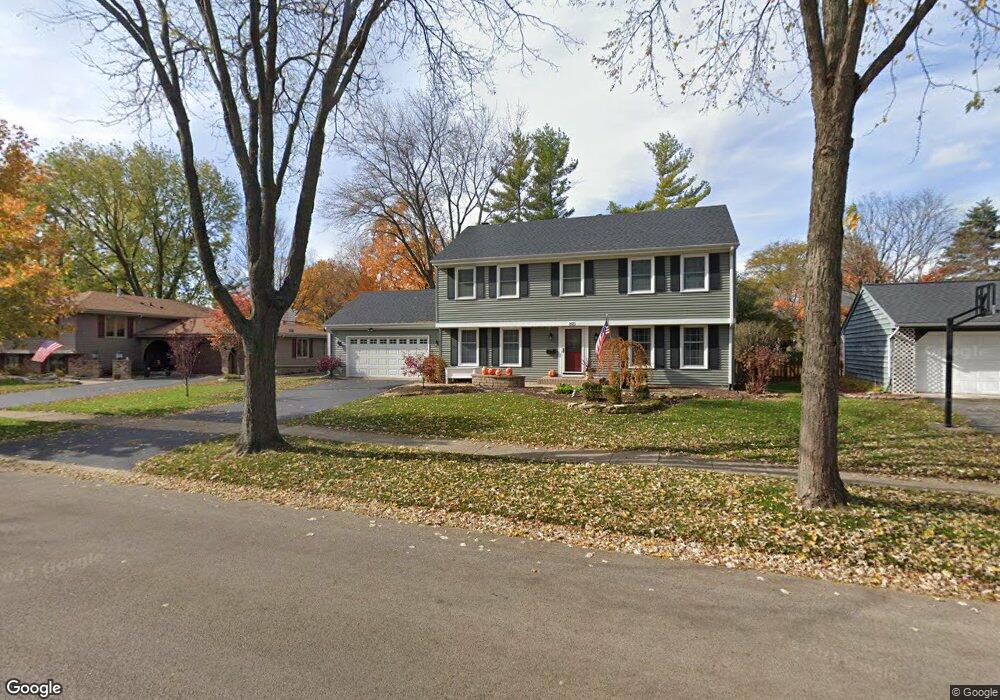
This home is located at 1421 7th Ct, Saint Charles, IL 60174 and is currently estimated at $484,288, approximately $215 per square foot. 1421 7th Ct is a home located in Kane County with nearby schools including Davis Primary School, Richmond Intermediate School, and Thompson Middle School.
Ownership History
Date
Name
Owned For
Owner Type
Purchase Details
Closed on
Jul 7, 2015
Sold by
Guerri Marc C and Guerri Jennifer L
Bought by
Schiltz Benjamin E and Schiltz Kathleen M
Current Estimated Value
Home Financials for this Owner
Home Financials are based on the most recent Mortgage that was taken out on this home.
Original Mortgage
$260,000
Outstanding Balance
$152,623
Interest Rate
3.86%
Mortgage Type
New Conventional
Estimated Equity
$331,665
Purchase Details
Closed on
Oct 29, 2004
Sold by
Decker George J and Decker Mary L
Bought by
Guerri Marc C and Guerri Jennifer L
Home Financials for this Owner
Home Financials are based on the most recent Mortgage that was taken out on this home.
Original Mortgage
$225,500
Interest Rate
5.81%
Mortgage Type
Purchase Money Mortgage
Create a Home Valuation Report for This Property
The Home Valuation Report is an in-depth analysis detailing your home's value as well as a comparison with similar homes in the area
Home Values in the Area
Average Home Value in this Area
Purchase History
| Date | Buyer | Sale Price | Title Company |
|---|---|---|---|
| Schiltz Benjamin E | $325,000 | Chicago Title Insurance Co | |
| Guerri Marc C | $298,500 | Chicago Title Insurance Comp |
Source: Public Records
Mortgage History
| Date | Status | Borrower | Loan Amount |
|---|---|---|---|
| Open | Schiltz Benjamin E | $260,000 | |
| Previous Owner | Guerri Marc C | $225,500 | |
| Closed | Guerri Marc C | $29,500 |
Source: Public Records
Tax History
| Year | Tax Paid | Tax Assessment Tax Assessment Total Assessment is a certain percentage of the fair market value that is determined by local assessors to be the total taxable value of land and additions on the property. | Land | Improvement |
|---|---|---|---|---|
| 2024 | $8,834 | $127,002 | $35,378 | $91,624 |
| 2023 | $8,457 | $113,669 | $31,664 | $82,005 |
| 2022 | $8,090 | $106,191 | $32,095 | $74,096 |
| 2021 | $7,766 | $101,221 | $30,593 | $70,628 |
| 2020 | $7,681 | $99,334 | $30,023 | $69,311 |
| 2019 | $7,541 | $97,368 | $29,429 | $67,939 |
| 2018 | $7,282 | $93,792 | $28,309 | $65,483 |
| 2017 | $7,087 | $90,585 | $27,341 | $63,244 |
| 2016 | $7,437 | $87,404 | $26,381 | $61,023 |
| 2015 | -- | $82,518 | $26,097 | $56,421 |
| 2014 | -- | $79,479 | $26,097 | $53,382 |
| 2013 | -- | $81,459 | $26,358 | $55,101 |
Source: Public Records
Map
Nearby Homes
- 629 N Lincoln Ave
- 1028 S 5th St
- 2753 Stone Cir
- 2749 Stone Cir
- 2719 Stone Cir
- 2747 Stone Cir
- 2751 Stone Cir
- 524 Bradbury Ln
- 1219 Elm St
- 1203 Elm St
- 1326 Elm St
- 1201 Ford St
- 712 S 5th St
- 412 Richards St
- 518 Illinois St
- 523 Eklund Ave
- 46 White Oak Cir Unit 2
- 52 White Oak Cir
- 31 Roosevelt St
- 1008 Pine St
- 1427 S 7th Ct
- 1427 7th Ct
- 1415 7th Ct Unit 1
- 721 Westfield Dr
- 727 Westfield Dr Unit 1
- 715 Westfield Dr
- 731 Westfield Dr
- 1409 7th Ct Unit 1
- 1433 7th Ct
- 1432 S 7th Ct
- 1420 S 7th Ct
- 1426 7th Ct
- 709 Westfield Dr
- 1432 7th Ct Unit 1
- 1420 7th Ct
- 735 Westfield Dr Unit 1
- 703 Westfield Dr
- 704 Gray St
- 1438 7th Ct
- 1414 S 7th Ct
Your Personal Tour Guide
Ask me questions while you tour the home.