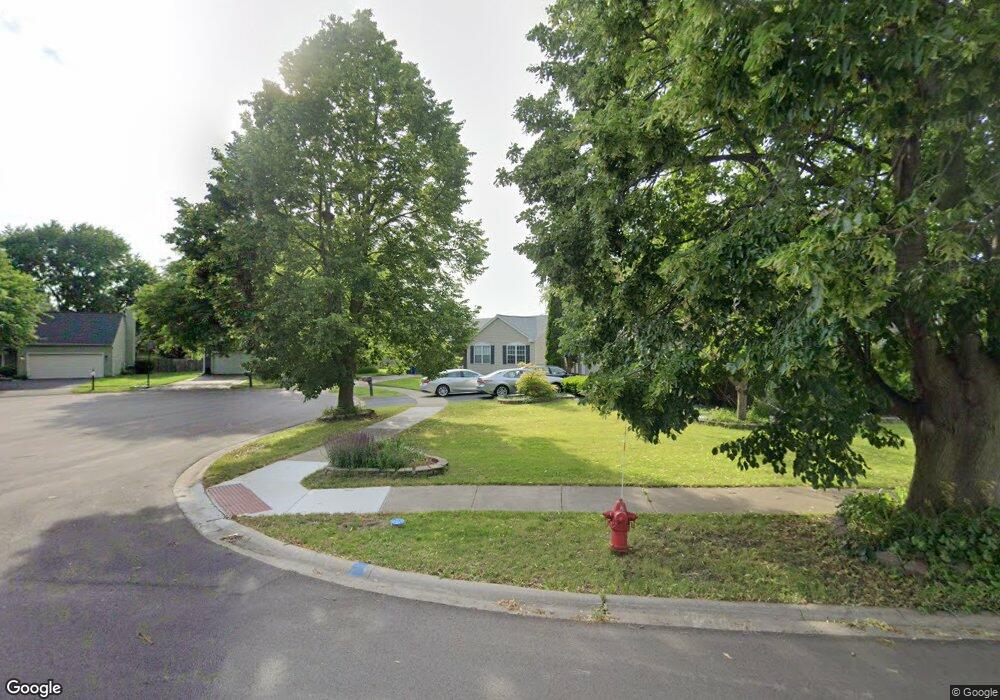
1421 Bar Harbour Rd Aurora, IL 60504
South East Village NeighborhoodEstimated Value: $338,000 - $395,000
3
Beds
2
Baths
1,363
Sq Ft
$263/Sq Ft
Est. Value
About This Home
This home is located at 1421 Bar Harbour Rd, Aurora, IL 60504 and is currently estimated at $358,716, approximately $263 per square foot. 1421 Bar Harbour Rd is a home located in DuPage County with nearby schools including Gombert Elementary School, Fischer Middle School, and Waubonsie Valley High School.
Ownership History
Date
Name
Owned For
Owner Type
Purchase Details
Closed on
Aug 7, 2003
Sold by
Wu Bin and Wei Yujie
Bought by
Wu Bin and Wei Yujie
Current Estimated Value
Purchase Details
Closed on
Aug 4, 2003
Sold by
Wu Bin
Bought by
Wu Bin and Wei Yujie
Purchase Details
Closed on
Sep 4, 2002
Sold by
Lasalle Bank National Assn
Bought by
Wu Bin
Purchase Details
Closed on
Apr 28, 2000
Sold by
Kulas Kirby L and Kulas Julie A
Bought by
Lasalle Bank National Assn and Trust #126083
Home Financials for this Owner
Home Financials are based on the most recent Mortgage that was taken out on this home.
Original Mortgage
$60,000
Interest Rate
8.21%
Purchase Details
Closed on
Apr 19, 1996
Sold by
Ludwig Robert C and Ludwig Juliel
Bought by
Kulas Kirby L and Kulas Julie A
Home Financials for this Owner
Home Financials are based on the most recent Mortgage that was taken out on this home.
Original Mortgage
$100,000
Interest Rate
7.44%
Mortgage Type
Balloon
Create a Home Valuation Report for This Property
The Home Valuation Report is an in-depth analysis detailing your home's value as well as a comparison with similar homes in the area
Home Values in the Area
Average Home Value in this Area
Purchase History
| Date | Buyer | Sale Price | Title Company |
|---|---|---|---|
| Wu Bin | -- | -- | |
| Wu Bin | -- | -- | |
| Wu Bin | -- | -- | |
| Lasalle Bank National Assn | $157,000 | Chicago Title Insurance Co | |
| Kulas Kirby L | $136,000 | -- |
Source: Public Records
Mortgage History
| Date | Status | Borrower | Loan Amount |
|---|---|---|---|
| Previous Owner | Lasalle Bank National Assn | $60,000 | |
| Previous Owner | Kulas Kirby L | $100,000 |
Source: Public Records
Tax History Compared to Growth
Tax History
| Year | Tax Paid | Tax Assessment Tax Assessment Total Assessment is a certain percentage of the fair market value that is determined by local assessors to be the total taxable value of land and additions on the property. | Land | Improvement |
|---|---|---|---|---|
| 2024 | $7,029 | $100,439 | $28,167 | $72,272 |
| 2023 | $6,684 | $90,250 | $25,310 | $64,940 |
| 2022 | $6,233 | $80,330 | $22,350 | $57,980 |
| 2021 | $6,062 | $77,460 | $21,550 | $55,910 |
| 2020 | $6,136 | $77,460 | $21,550 | $55,910 |
| 2019 | $5,912 | $73,680 | $20,500 | $53,180 |
| 2018 | $5,221 | $65,110 | $17,970 | $47,140 |
| 2017 | $5,127 | $62,900 | $17,360 | $45,540 |
| 2016 | $5,026 | $60,360 | $16,660 | $43,700 |
| 2015 | $4,963 | $57,310 | $15,820 | $41,490 |
| 2014 | $5,525 | $61,450 | $16,830 | $44,620 |
| 2013 | $5,469 | $61,880 | $16,950 | $44,930 |
Source: Public Records
Map
Nearby Homes
- 1335 Lawrence Ct
- 1465 Bridgeport Ln Unit 19D
- 2860 Bridgeport Ln Unit 19D
- 2730 Dorothy Dr Unit 1
- 2632 Emma Cir
- 3144 Johnsbury Ln
- 3290 Johnsbury Ct
- 2723 Rosehall Ln
- 1334 Normantown Rd Unit 334
- 2476 Village Ct Unit 2
- 2509 Rosehall Ln
- 2489 Rosehall Ln
- 3479 Charlemaine Dr
- 3467 Charlemaine Dr
- 2297 Lakeside Dr Unit 10
- 2901 Shelly Ln
- 2950 Shelly Ln Unit 2950
- 3264 Oak Creek Ln
- 3437 Charlemaine Dr
- 3185 Ketch Ct Unit 606
- 1425 Bar Harbour Rd
- 1417 Bar Harbour Rd
- 2855 Bar Harbour Ct
- 2865 Bar Harbour Ct Unit 19D
- 2845 Bar Harbour Ct
- 1429 Bar Harbour Rd
- 2875 Bar Harbour Ct
- 1316 Valayna Dr
- 1320 Valayna Dr
- 1312 Valayna Dr
- 1324 Valayna Dr
- 1433 Bar Harbour Rd
- 1308 Valayna Dr
- 2840 Bar Harbour Ct
- 2885 Bar Harbour Ct
- 1424 Bar Harbour Rd Unit 19D
- 1428 Bar Harbour Rd Unit 19D
- 1328 Valayna Dr
- 1432 Bar Harbour Rd Unit 19D
- 1437 Bar Harbour Rd Unit 19D