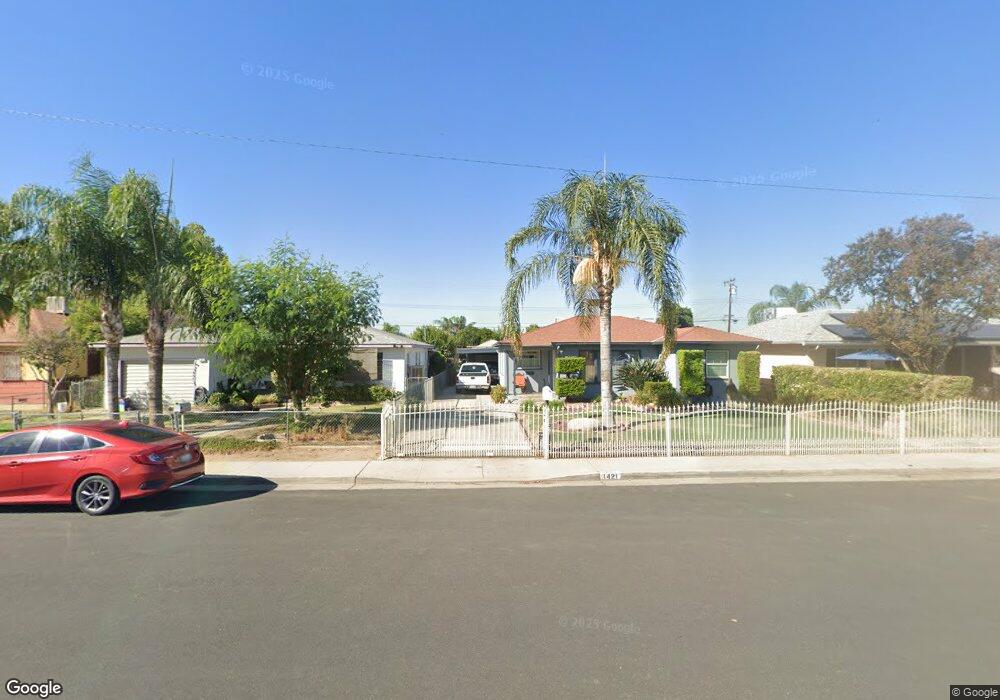
1421 Dover St Delano, CA 93215
West Delano NeighborhoodEstimated Value: $272,000 - $362,000
4
Beds
2
Baths
1,528
Sq Ft
$202/Sq Ft
Est. Value
About This Home
This home is located at 1421 Dover St, Delano, CA 93215 and is currently estimated at $308,020, approximately $201 per square foot. 1421 Dover St is a home located in Kern County with nearby schools including Fremont Elementary School, Almond Tree Middle School, and Robert F. Kennedy High School.
Ownership History
Date
Name
Owned For
Owner Type
Purchase Details
Closed on
May 20, 2024
Sold by
Agundez Ayon Ramon and Agundez Elena Maria
Bought by
Tiger Family Trust and Ayon
Current Estimated Value
Purchase Details
Closed on
Apr 2, 1998
Sold by
Hellen Simplicia D
Bought by
Agundez Ramon and Agundez Maria Elena
Home Financials for this Owner
Home Financials are based on the most recent Mortgage that was taken out on this home.
Original Mortgage
$79,601
Interest Rate
7.11%
Mortgage Type
FHA
Create a Home Valuation Report for This Property
The Home Valuation Report is an in-depth analysis detailing your home's value as well as a comparison with similar homes in the area
Home Values in the Area
Average Home Value in this Area
Purchase History
| Date | Buyer | Sale Price | Title Company |
|---|---|---|---|
| Tiger Family Trust | -- | None Listed On Document | |
| Agundez Ramon | $79,500 | Stewart Title |
Source: Public Records
Mortgage History
| Date | Status | Borrower | Loan Amount |
|---|---|---|---|
| Previous Owner | Agundez Ramon | $79,601 |
Source: Public Records
Tax History
| Year | Tax Paid | Tax Assessment Tax Assessment Total Assessment is a certain percentage of the fair market value that is determined by local assessors to be the total taxable value of land and additions on the property. | Land | Improvement |
|---|---|---|---|---|
| 2025 | $1,489 | $126,907 | $25,530 | $101,377 |
| 2024 | $1,445 | $124,420 | $25,030 | $99,390 |
| 2023 | $1,445 | $121,982 | $24,540 | $97,442 |
| 2022 | $1,417 | $119,591 | $24,059 | $95,532 |
| 2021 | $1,348 | $117,247 | $23,588 | $93,659 |
| 2020 | $1,341 | $116,046 | $23,347 | $92,699 |
| 2019 | $1,316 | $116,046 | $23,347 | $92,699 |
| 2018 | $1,298 | $111,542 | $22,442 | $89,100 |
| 2017 | $1,305 | $109,355 | $22,002 | $87,353 |
| 2016 | $1,282 | $107,212 | $21,571 | $85,641 |
| 2015 | $1,324 | $105,602 | $21,247 | $84,355 |
| 2014 | $1,235 | $103,534 | $20,831 | $82,703 |
Source: Public Records
Map
Nearby Homes
Your Personal Tour Guide
Ask me questions while you tour the home.