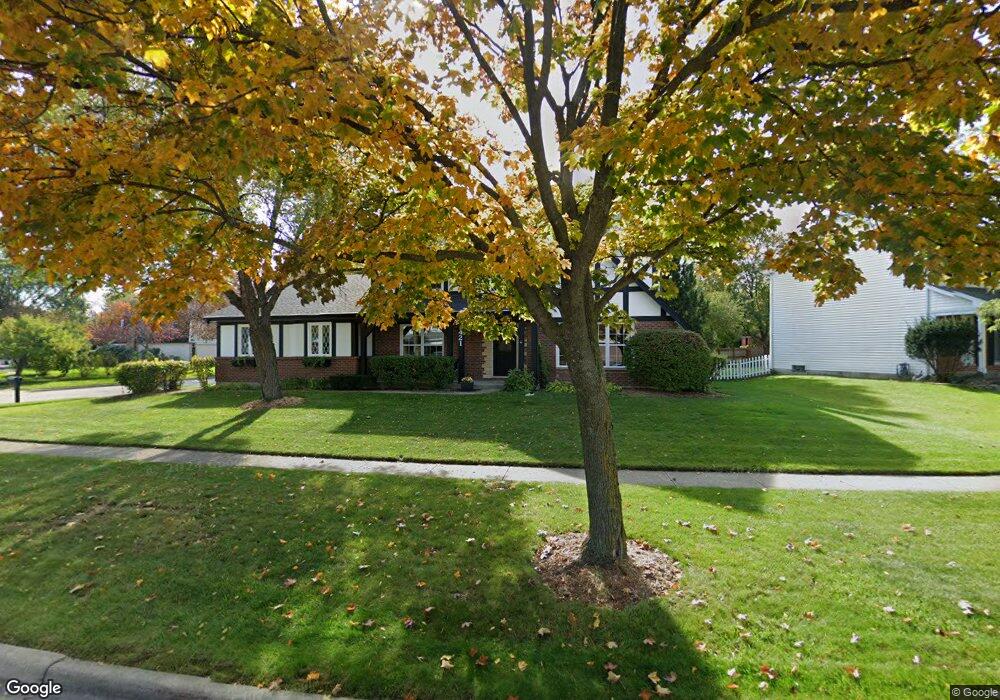
1421 Huntington Dr Mundelein, IL 60060
Cambridge Chase NeighborhoodEstimated Value: $493,521 - $523,000
--
Bed
3
Baths
2,749
Sq Ft
$185/Sq Ft
Est. Value
About This Home
This home is located at 1421 Huntington Dr, Mundelein, IL 60060 and is currently estimated at $508,630, approximately $185 per square foot. 1421 Huntington Dr is a home located in Lake County with nearby schools including Hawthorn Elementary School North, Hawthorn School Of Dual Language, and Hawthorn Middle School North.
Ownership History
Date
Name
Owned For
Owner Type
Purchase Details
Closed on
Oct 28, 2015
Sold by
Valentini Kathleen A and Valentini Dennis A
Bought by
Valentin Dennis A Valentini and Valentin Kathleen A
Current Estimated Value
Purchase Details
Closed on
Nov 28, 2001
Sold by
Valentini Dennis A and Valentini Kathleen A
Bought by
Valentini Kathleen A and Valentini Dennis A
Purchase Details
Closed on
Nov 1, 1994
Sold by
Valentini Dennis A and Valentini Kathleen A
Bought by
Valentini Dennis A and Valentini Kathleen A
Purchase Details
Closed on
Dec 27, 1993
Sold by
American National Bk & Tr Co Of Chicago
Bought by
Valentini Dennis A and Valentini Kathleen A
Home Financials for this Owner
Home Financials are based on the most recent Mortgage that was taken out on this home.
Original Mortgage
$104,000
Interest Rate
7.26%
Create a Home Valuation Report for This Property
The Home Valuation Report is an in-depth analysis detailing your home's value as well as a comparison with similar homes in the area
Home Values in the Area
Average Home Value in this Area
Purchase History
| Date | Buyer | Sale Price | Title Company |
|---|---|---|---|
| Valentin Dennis A Valentini | -- | Attorney | |
| Valentini Kathleen A | -- | -- | |
| Valentini Dennis A | -- | -- | |
| Valentini Dennis A | -- | Lawyers Title Insurance Corp |
Source: Public Records
Mortgage History
| Date | Status | Borrower | Loan Amount |
|---|---|---|---|
| Closed | Valentini Dennis A | $104,000 |
Source: Public Records
Tax History Compared to Growth
Tax History
| Year | Tax Paid | Tax Assessment Tax Assessment Total Assessment is a certain percentage of the fair market value that is determined by local assessors to be the total taxable value of land and additions on the property. | Land | Improvement |
|---|---|---|---|---|
| 2024 | $12,005 | $145,439 | $28,162 | $117,277 |
| 2023 | $12,226 | $134,144 | $25,975 | $108,169 |
| 2022 | $12,226 | $131,017 | $24,965 | $106,052 |
| 2021 | $11,739 | $128,197 | $24,428 | $103,769 |
| 2020 | $11,406 | $126,041 | $24,017 | $102,024 |
| 2019 | $11,153 | $124,843 | $23,789 | $101,054 |
| 2018 | $5,909 | $121,595 | $22,832 | $98,763 |
| 2017 | $10,548 | $117,756 | $22,111 | $95,645 |
| 2016 | $10,079 | $111,649 | $20,964 | $90,685 |
| 2015 | $9,800 | $104,354 | $19,594 | $84,760 |
| 2014 | $8,934 | $94,995 | $17,918 | $77,077 |
| 2012 | $9,249 | $95,819 | $18,073 | $77,746 |
Source: Public Records
Map
Nearby Homes
- 422 Shadow Creek Dr
- 2245 Hazeltime Dr
- 31 Washington Blvd Unit 108
- 1255 Huntington Dr
- 1726 Shoal Creek Terrace
- 215 Brice Ave
- 841 Wilcox St
- 1688 Saint Andrew Dr
- 49 N Shaddle Ave
- 328 Brice Ave
- 1969 Royal Birkdale Dr
- 701 Thomas Ct
- 847 Mckinley Ave
- 1654 Pebble Beach Way
- 1290 Butterfield Rd
- 422 James Ave
- 1017 Juniper Pkwy
- 501 Hemlock Ln
- 1939 Lake Charles Dr
- 1933 Lake Charles Dr
- 1417 Huntington Dr
- 12 N Parliament Way
- 50 N Parliament Way
- 1413 Huntington Dr
- 1425 Huntington Dr
- 8 N Parliament Way
- 11 N Parliament Way
- 1409 Huntington Dr
- 1408 Huntington Dr
- 7 N Parliament Way
- 1412 Huntington Dr
- 1404 Huntington Dr
- 1429 Huntington Dr
- 1398 Huntington Dr
- 4 N Parliament Way
- 1416 Huntington Dr
- 3 N Parliament Way
- 1400 Huntington Dr
- 1405 Huntington Dr
- 1433 Huntington Dr