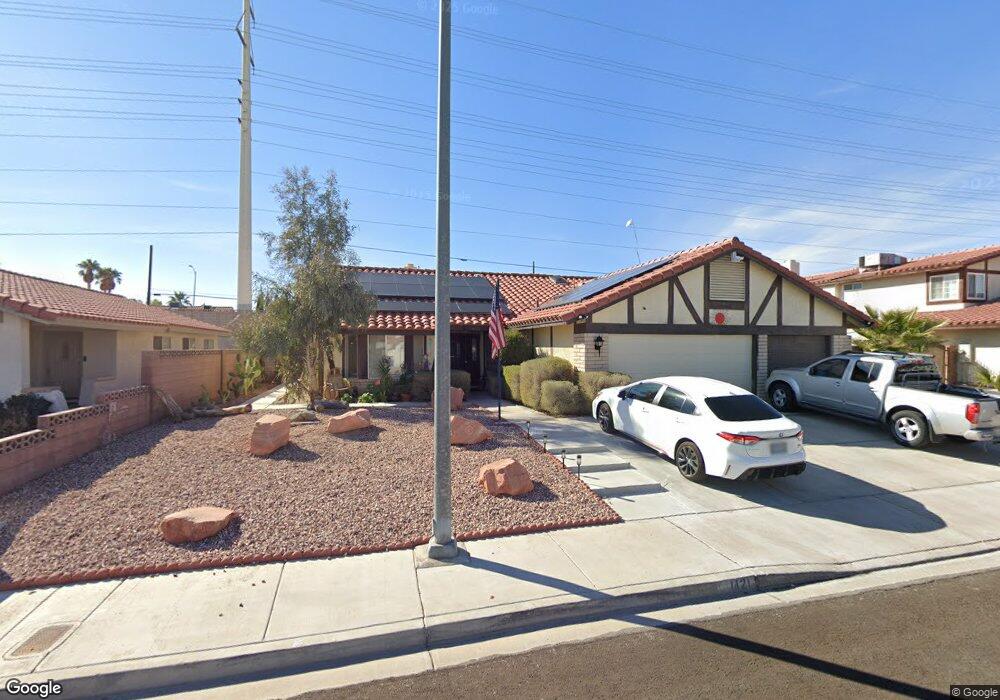
1421 Kirby Dr Las Vegas, NV 89117
Canyon Gate NeighborhoodEstimated Value: $526,000 - $568,000
3
Beds
2
Baths
1,888
Sq Ft
$285/Sq Ft
Est. Value
About This Home
This home is located at 1421 Kirby Dr, Las Vegas, NV 89117 and is currently estimated at $538,176, approximately $285 per square foot. 1421 Kirby Dr is a home located in Clark County with nearby schools including Herbert A. Derfelt Elementary School, Walter Johnson Junior High School Academy of International Studies, and Bonanza High School.
Ownership History
Date
Name
Owned For
Owner Type
Purchase Details
Closed on
Aug 7, 2025
Sold by
Valencia Espiridion S
Bought by
Espiridion S Valencia Trust and Valencia
Current Estimated Value
Purchase Details
Closed on
Aug 21, 2015
Sold by
Valencia Espiridion S and Valencia Espiradion S
Bought by
Valencia Espiridion S
Home Financials for this Owner
Home Financials are based on the most recent Mortgage that was taken out on this home.
Original Mortgage
$158,800
Interest Rate
4.05%
Mortgage Type
New Conventional
Purchase Details
Closed on
Jul 23, 2009
Sold by
Korobkin Marc Stuart and Peterman Michael
Bought by
Valencia Espiradion S
Home Financials for this Owner
Home Financials are based on the most recent Mortgage that was taken out on this home.
Original Mortgage
$181,649
Interest Rate
5.37%
Mortgage Type
FHA
Create a Home Valuation Report for This Property
The Home Valuation Report is an in-depth analysis detailing your home's value as well as a comparison with similar homes in the area
Home Values in the Area
Average Home Value in this Area
Purchase History
| Date | Buyer | Sale Price | Title Company |
|---|---|---|---|
| Espiridion S Valencia Trust | -- | None Listed On Document | |
| Valencia Espiridion S | -- | Netco | |
| Valencia Espiradion S | $185,000 | Noble Title |
Source: Public Records
Mortgage History
| Date | Status | Borrower | Loan Amount |
|---|---|---|---|
| Previous Owner | Valencia Espiridion S | $158,800 | |
| Previous Owner | Valencia Espiradion S | $181,649 |
Source: Public Records
Tax History Compared to Growth
Tax History
| Year | Tax Paid | Tax Assessment Tax Assessment Total Assessment is a certain percentage of the fair market value that is determined by local assessors to be the total taxable value of land and additions on the property. | Land | Improvement |
|---|---|---|---|---|
| 2025 | $2,270 | $104,759 | $45,850 | $58,909 |
| 2024 | $2,205 | $104,759 | $45,850 | $58,909 |
| 2023 | $1,778 | $96,968 | $40,250 | $56,718 |
| 2022 | $2,141 | $86,618 | $34,300 | $52,318 |
| 2021 | $2,078 | $79,507 | $29,400 | $50,107 |
| 2020 | $2,015 | $79,341 | $29,400 | $49,941 |
| 2019 | $1,990 | $76,213 | $26,600 | $49,613 |
| 2018 | $1,899 | $71,539 | $23,450 | $48,089 |
| 2017 | $2,330 | $71,070 | $22,050 | $49,020 |
| 2016 | $1,778 | $67,020 | $17,500 | $49,520 |
| 2015 | $1,774 | $63,168 | $14,000 | $49,168 |
| 2014 | $1,722 | $50,975 | $12,250 | $38,725 |
Source: Public Records
Map
Nearby Homes
- 1517 Kirby Dr
- 8505 Custer Ct
- 1536 Brocado Ln
- 1209 Emerywood Ct
- 1613 Iron Ridge Dr
- 1805 Quail Point Ct
- 8600 W Charleston Blvd Unit 1079
- 8600 W Charleston Blvd Unit 2058
- 8600 W Charleston Blvd Unit 1030
- 8600 W Charleston Blvd Unit 1075
- 8600 W Charleston Blvd Unit 2195
- 8600 W Charleston Blvd Unit 2101
- 8400 W Charleston Blvd Unit 237
- 8400 W Charleston Blvd Unit 111
- 1813 Skyline Dr
- 900 Heavenly Hills Ct Unit 219
- 805 Overview Dr
- 8721 Robinson Ridge Dr
- 8324 W Charleston Blvd Unit 2002
- 8324 W Charleston Blvd Unit 1047