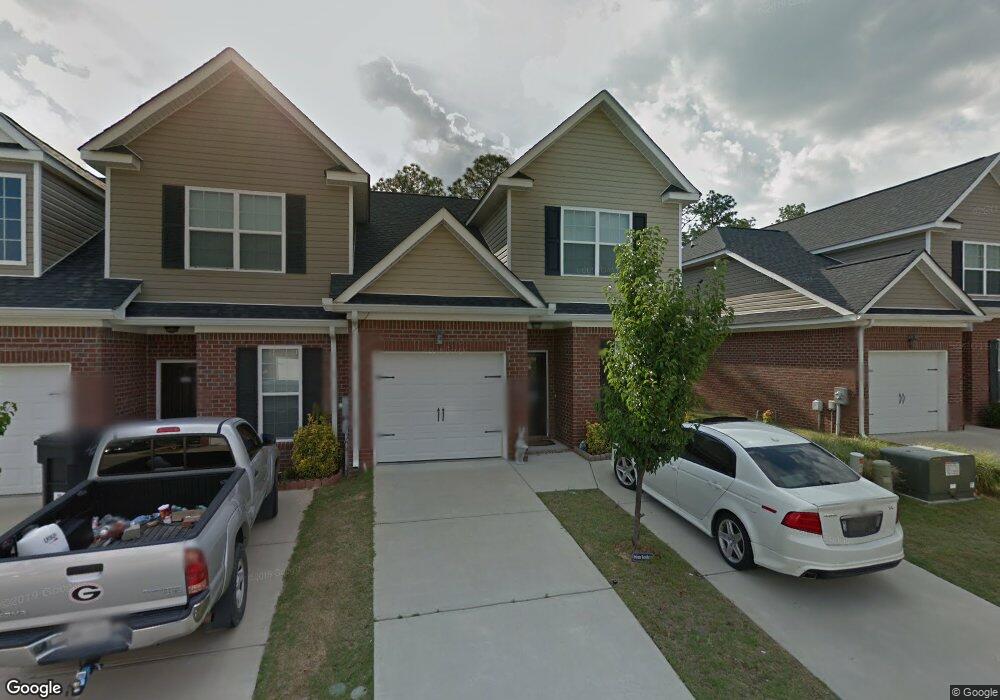
1421 Leigh Ct Augusta, GA 30909
Belair NeighborhoodEstimated Value: $233,317 - $258,000
4
Beds
3
Baths
1,740
Sq Ft
$140/Sq Ft
Est. Value
About This Home
This home is located at 1421 Leigh Ct, Augusta, GA 30909 and is currently estimated at $243,829, approximately $140 per square foot. 1421 Leigh Ct is a home located in Richmond County with nearby schools including R.B. Hunt Elementary School, Sue Reynolds Elementary School, and Langford Middle School.
Ownership History
Date
Name
Owned For
Owner Type
Purchase Details
Closed on
Jan 13, 2025
Sold by
Gomez Alex
Bought by
Pegom Llc
Current Estimated Value
Purchase Details
Closed on
Feb 16, 2012
Sold by
Budwick Peter
Bought by
Eisele Karen B
Home Financials for this Owner
Home Financials are based on the most recent Mortgage that was taken out on this home.
Original Mortgage
$118,000
Interest Rate
3.89%
Mortgage Type
New Conventional
Purchase Details
Closed on
Sep 19, 2011
Sold by
Johnson Trevis A
Bought by
National Residential Nominee S
Purchase Details
Closed on
May 16, 2008
Sold by
Johnson & Todd Investments Llc
Bought by
Johnson Trevis A
Home Financials for this Owner
Home Financials are based on the most recent Mortgage that was taken out on this home.
Original Mortgage
$122,150
Interest Rate
5.86%
Mortgage Type
Purchase Money Mortgage
Create a Home Valuation Report for This Property
The Home Valuation Report is an in-depth analysis detailing your home's value as well as a comparison with similar homes in the area
Home Values in the Area
Average Home Value in this Area
Purchase History
| Date | Buyer | Sale Price | Title Company |
|---|---|---|---|
| Pegom Llc | -- | -- | |
| Eisele Karen B | $118,000 | -- | |
| Budwick Peter | $118,000 | -- | |
| National Residential Nominee S | $127,500 | -- | |
| Johnson Trevis A | $152,700 | None Available |
Source: Public Records
Mortgage History
| Date | Status | Borrower | Loan Amount |
|---|---|---|---|
| Previous Owner | Budwick Peter | $118,000 | |
| Previous Owner | Johnson Trevis A | $122,150 |
Source: Public Records
Tax History Compared to Growth
Tax History
| Year | Tax Paid | Tax Assessment Tax Assessment Total Assessment is a certain percentage of the fair market value that is determined by local assessors to be the total taxable value of land and additions on the property. | Land | Improvement |
|---|---|---|---|---|
| 2025 | $2,966 | $94,740 | $14,000 | $80,740 |
| 2024 | $2,966 | $87,628 | $14,000 | $73,628 |
| 2023 | $2,661 | $83,088 | $14,000 | $69,088 |
| 2022 | $2,236 | $73,740 | $14,000 | $59,740 |
| 2021 | $1,949 | $58,308 | $14,000 | $44,308 |
| 2020 | $1,918 | $58,308 | $14,000 | $44,308 |
| 2019 | $1,871 | $53,228 | $8,920 | $44,308 |
| 2018 | $1,884 | $53,228 | $8,920 | $44,308 |
| 2017 | $1,875 | $53,228 | $8,920 | $44,308 |
| 2016 | $1,876 | $53,228 | $8,920 | $44,308 |
| 2015 | $2,053 | $53,228 | $8,920 | $44,308 |
| 2014 | $2,043 | $52,848 | $8,920 | $43,928 |
Source: Public Records
Map
Nearby Homes
- 3023 Abba Dr
- 4005 Calypso Dr
- 1731 Elizabeth St
- 300 Nevis Dr
- 107 Barts Dr
- 308 Nevis Dr
- 1340 Flowing Wells Rd
- 5034 Wheeler Lake Rd
- 2631 Chaucer Dr
- 2210 Larks Ct
- 1348 Maddox Dr
- 5129 Wheeler Lake Rd
- 1230 Brookstone Way
- 3830 Maddox Rd
- 3902 Maddox Rd
- 5249 Aruba Cir
- 3261 Peninsula Dr
- 1404 Feldspar Ct
- 505 Bradley Ct
- 1264 Marks Church Rd