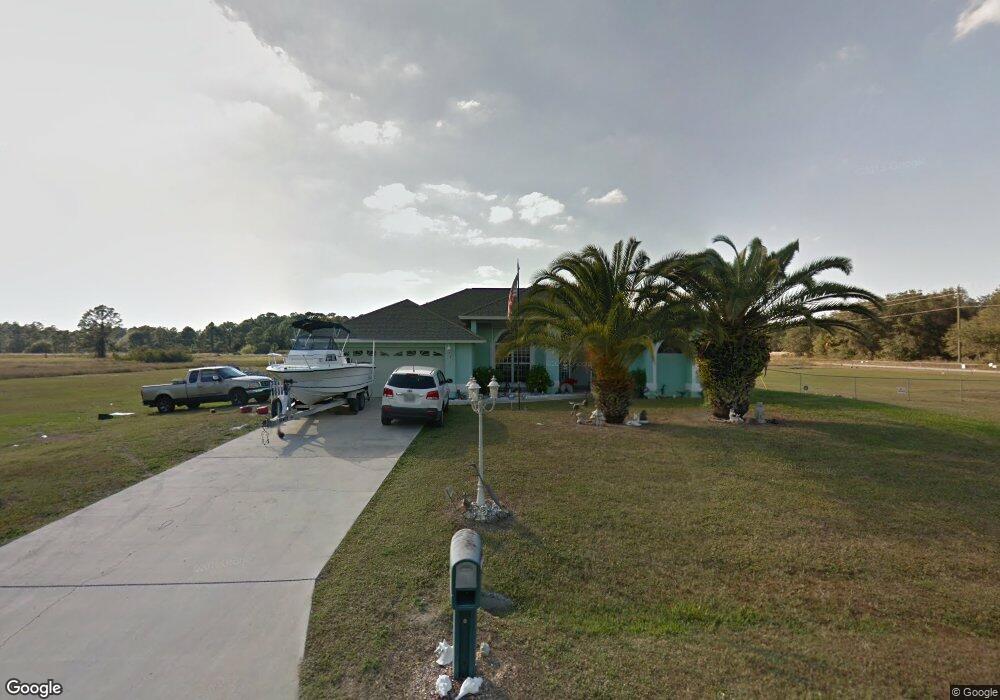
1421 Leroy Ave Unit 7 Lehigh Acres, FL 33972
Joel NeighborhoodEstimated Value: $358,725 - $565,000
3
Beds
2
Baths
2,804
Sq Ft
$150/Sq Ft
Est. Value
About This Home
This home is located at 1421 Leroy Ave Unit 7, Lehigh Acres, FL 33972 and is currently estimated at $419,681, approximately $149 per square foot. 1421 Leroy Ave Unit 7 is a home located in Lee County with nearby schools including The Alva School, Lehigh Elementary School, and Gateway Elementary School.
Ownership History
Date
Name
Owned For
Owner Type
Purchase Details
Closed on
Jan 29, 2018
Sold by
Pugh Philip B
Bought by
Vest Dale and Vest Saundra
Current Estimated Value
Home Financials for this Owner
Home Financials are based on the most recent Mortgage that was taken out on this home.
Original Mortgage
$167,887
Outstanding Balance
$144,061
Interest Rate
4.62%
Mortgage Type
FHA
Estimated Equity
$275,620
Purchase Details
Closed on
Oct 6, 2009
Sold by
Vest Dale and Vest Saundra L
Bought by
Pugh Philip B and Philip B Pugh Revocable Trust
Purchase Details
Closed on
Jun 21, 2006
Sold by
Canty John H and Canty Julia B
Bought by
Vest Dale and Vest Saundra L
Home Financials for this Owner
Home Financials are based on the most recent Mortgage that was taken out on this home.
Original Mortgage
$442,000
Interest Rate
6.57%
Mortgage Type
Unknown
Purchase Details
Closed on
Aug 7, 2000
Sold by
Romer Lillian J
Bought by
Canty John H and Canty Julia B
Create a Home Valuation Report for This Property
The Home Valuation Report is an in-depth analysis detailing your home's value as well as a comparison with similar homes in the area
Home Values in the Area
Average Home Value in this Area
Purchase History
| Date | Buyer | Sale Price | Title Company |
|---|---|---|---|
| Vest Dale | $171,000 | Attorney | |
| Pugh Philip B | $75,000 | Patriot Title Services Llc | |
| Vest Dale | $442,000 | Homestead Land & Title Inc | |
| Canty John H | $2,500 | -- |
Source: Public Records
Mortgage History
| Date | Status | Borrower | Loan Amount |
|---|---|---|---|
| Open | Vest Dale | $167,887 | |
| Previous Owner | Vest Dale | $442,000 |
Source: Public Records
Tax History Compared to Growth
Tax History
| Year | Tax Paid | Tax Assessment Tax Assessment Total Assessment is a certain percentage of the fair market value that is determined by local assessors to be the total taxable value of land and additions on the property. | Land | Improvement |
|---|---|---|---|---|
| 2025 | $3,717 | $271,250 | -- | -- |
| 2024 | $3,604 | $263,605 | -- | -- |
| 2023 | $3,604 | $255,927 | $0 | $0 |
| 2022 | $3,393 | $248,473 | $0 | $0 |
| 2021 | $3,317 | $258,862 | $15,494 | $243,368 |
| 2020 | $3,336 | $237,905 | $0 | $0 |
| 2019 | $3,244 | $232,556 | $9,600 | $222,956 |
| 2018 | $2,877 | $209,136 | $9,000 | $200,136 |
| 2017 | $2,820 | $207,516 | $8,800 | $198,716 |
| 2016 | $2,585 | $180,698 | $11,983 | $168,715 |
| 2015 | $2,343 | $153,202 | $13,166 | $140,036 |
| 2014 | -- | $135,101 | $12,323 | $122,778 |
| 2013 | -- | $78,191 | $8,258 | $69,933 |
Source: Public Records
Map
Nearby Homes
- 1415 Johns Ave John
- 3707 E 15th St
- 3803 E 15th St
- 3804 E 15th St
- 1205 Leroy Ave
- 3602 E 14th St
- 1312 Monroe Ave
- 1316 Monroe Ave
- 1900 Monroe Ave
- 1409 Monroe Ave
- 3802 E 14th St
- 1517 Scott Ave
- 1314 Scott Ave
- 1316 Scott Ave
- 721 Scott Ave
- 1516 Scott Ave
- 1512 Scott Ave
- 1502 Johns Ave
- 3805 E 16th St
- 502 Moore Ave
- 1419 Leroy Ave
- 1501 Leroy Ave
- 3702 E 15th St
- 3701 15th St SW
- 1416 Leroy Ave
- 3703 E 15th St
- 1413 Leroy Ave
- 3704 E 15th St
- 1502 Leroy Ave
- 1502 Leroy Ave Unit 11
- 1421 Johns Ave Unit 7
- 1419 Johns Ave
- 3507 E 15th St
- 1417 Monroe Ave
- 3504 E 15th St
- 1415 N Johns
- 1415 W Johns Ave
- 3505 E 15th St
- 1503 Monroe Ave