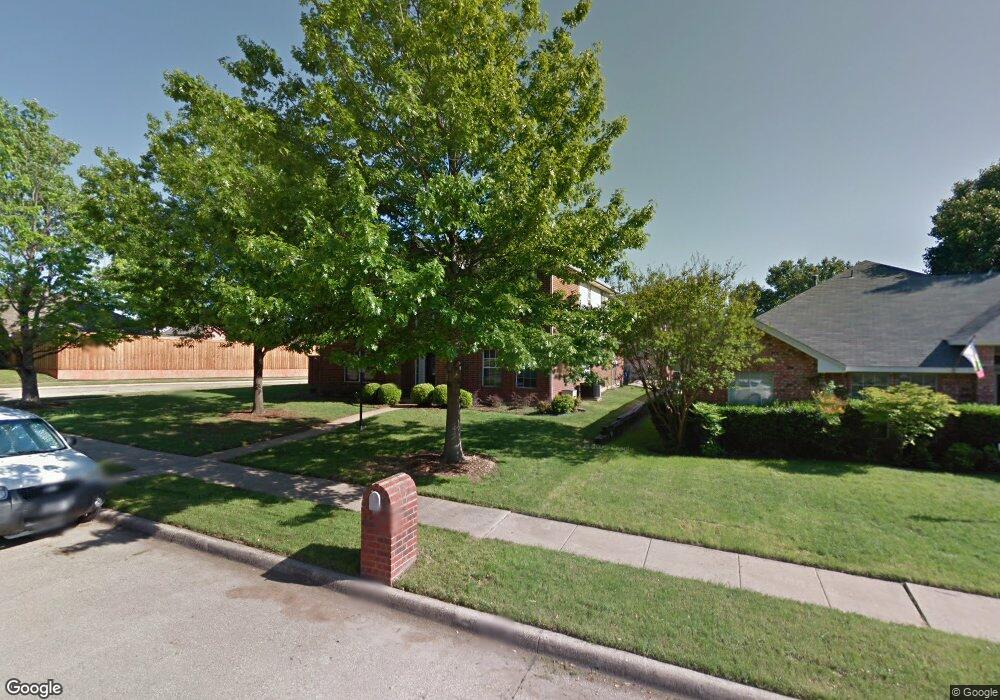
1421 Mapleview Dr Carrollton, TX 75007
Northwest Carrollton NeighborhoodEstimated Value: $451,191 - $487,000
4
Beds
3
Baths
2,282
Sq Ft
$206/Sq Ft
Est. Value
About This Home
This home is located at 1421 Mapleview Dr, Carrollton, TX 75007 and is currently estimated at $469,798, approximately $205 per square foot. 1421 Mapleview Dr is a home located in Denton County with nearby schools including Kent Elementary School, Blalack Middle School, and Creekview High School.
Ownership History
Date
Name
Owned For
Owner Type
Purchase Details
Closed on
Jul 29, 2020
Sold by
Open House Texas Rlty & Investments Llc
Bought by
Mukai Llc
Current Estimated Value
Purchase Details
Closed on
May 2, 2019
Sold by
Biegger Norman D and Biegger Kelli
Bought by
Open House Texas Rlty & Investments Llc
Purchase Details
Closed on
Dec 29, 2014
Sold by
Ethridge Andrew D and Ethridge Annette
Bought by
Biegger Norman D and Biegger Kelli
Home Financials for this Owner
Home Financials are based on the most recent Mortgage that was taken out on this home.
Original Mortgage
$250,250
Interest Rate
4.01%
Mortgage Type
VA
Purchase Details
Closed on
Jun 7, 1996
Sold by
Williams Paul Edgar and Williams Suzanne Von Einem
Bought by
Ethridge Andrew D and Ethridge Annette
Home Financials for this Owner
Home Financials are based on the most recent Mortgage that was taken out on this home.
Original Mortgage
$131,550
Interest Rate
7.92%
Create a Home Valuation Report for This Property
The Home Valuation Report is an in-depth analysis detailing your home's value as well as a comparison with similar homes in the area
Home Values in the Area
Average Home Value in this Area
Purchase History
| Date | Buyer | Sale Price | Title Company |
|---|---|---|---|
| Mukai Llc | -- | Lawyers Title | |
| Open House Texas Rlty & Investments Llc | -- | None Available | |
| Biegger Norman D | -- | Tiago Title Llc | |
| Ethridge Andrew D | -- | -- |
Source: Public Records
Mortgage History
| Date | Status | Borrower | Loan Amount |
|---|---|---|---|
| Previous Owner | Biegger Norman D | $250,250 | |
| Previous Owner | Ethridge Andrew D | $131,550 |
Source: Public Records
Tax History Compared to Growth
Tax History
| Year | Tax Paid | Tax Assessment Tax Assessment Total Assessment is a certain percentage of the fair market value that is determined by local assessors to be the total taxable value of land and additions on the property. | Land | Improvement |
|---|---|---|---|---|
| 2025 | $7,935 | $442,000 | $104,076 | $337,924 |
| 2024 | $7,935 | $464,000 | $104,076 | $359,924 |
| 2023 | $7,874 | $456,000 | $101,880 | $354,120 |
| 2022 | $6,903 | $359,000 | $81,774 | $277,226 |
| 2021 | $6,532 | $316,000 | $59,472 | $256,528 |
| 2020 | $6,105 | $293,000 | $59,472 | $233,528 |
| 2019 | $6,419 | $293,026 | $59,472 | $233,554 |
| 2018 | $6,236 | $281,084 | $59,472 | $221,612 |
| 2017 | $5,897 | $262,800 | $59,472 | $206,561 |
| 2016 | $5,361 | $238,909 | $46,463 | $192,446 |
| 2015 | $3,814 | $233,644 | $46,463 | $187,181 |
| 2013 | -- | $193,185 | $46,463 | $146,722 |
Source: Public Records
Map
Nearby Homes
- 1464 Summerhill Dr
- 3309 Susan Ln
- 3528 Eisenhower St
- 1529 Arrowhead Ln
- 3110 Glenmere Ct
- 1429 Indian Springs
- 1305 Pawnee Trail
- 1112 Pawnee Trail
- 1119 Tahlequah Trail
- 1407 Pawnee Trail
- 3816 Quivera Cir
- 3102 Aspen
- 1203 Sycamore Dr
- 3103 Birch Dr
- 1027 Ridgeview Cir
- 3622 Flagstone Dr
- 1036 Clinton St
- 1211 Mackie Dr
- 1006 Bellflower Ct
- 1104 Elk Trail
- 1423 Mapleview Dr
- 1419 Mapleview Dr
- 1425 Mapleview Dr
- 1420 Dudley Dr
- 1422 Dudley Dr
- 1422 Mapleview Dr
- 1424 Mapleview Dr
- 1418 Dudley Dr
- 1420 Mapleview Dr
- 1424 Dudley Dr
- 1426 Mapleview Dr
- 1417 Mapleview Dr
- 1427 Mapleview Dr
- 1418 Mapleview Dr
- 1416 Dudley Dr
- 1428 Mapleview Dr
- 1415 Mapleview Dr
- 1429 Mapleview Dr
- 1416 Mapleview Dr
- 1430 Mapleview Dr