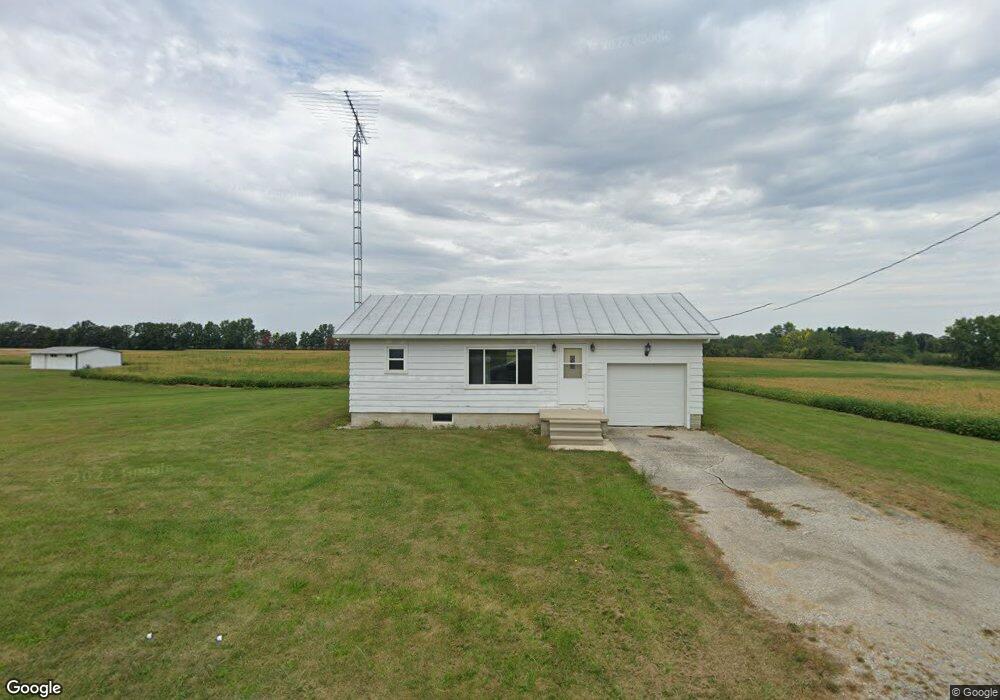
14212 State Highway 53 W Upper Sandusky, OH 43351
Estimated Value: $95,003 - $199,000
--
Bed
--
Bath
672
Sq Ft
$204/Sq Ft
Est. Value
About This Home
This home is located at 14212 State Highway 53 W, Upper Sandusky, OH 43351 and is currently estimated at $137,001, approximately $203 per square foot. 14212 State Highway 53 W is a home with nearby schools including Upper Sandusky High School.
Ownership History
Date
Name
Owned For
Owner Type
Purchase Details
Closed on
Feb 6, 2023
Sold by
Ssdlt Farms Llc
Bought by
Thiel Jacob M
Current Estimated Value
Home Financials for this Owner
Home Financials are based on the most recent Mortgage that was taken out on this home.
Original Mortgage
$70,000
Outstanding Balance
$67,804
Interest Rate
6.33%
Mortgage Type
New Conventional
Estimated Equity
$69,197
Purchase Details
Closed on
Dec 21, 2022
Sold by
Thiel Shannon M
Bought by
Sssdlt Farms Llc
Home Financials for this Owner
Home Financials are based on the most recent Mortgage that was taken out on this home.
Original Mortgage
$70,000
Outstanding Balance
$67,804
Interest Rate
6.33%
Mortgage Type
New Conventional
Estimated Equity
$69,197
Purchase Details
Closed on
Dec 1, 2022
Sold by
Frey Todd D
Bought by
Thiel Shannon M and Thiel Shawn D
Create a Home Valuation Report for This Property
The Home Valuation Report is an in-depth analysis detailing your home's value as well as a comparison with similar homes in the area
Home Values in the Area
Average Home Value in this Area
Purchase History
| Date | Buyer | Sale Price | Title Company |
|---|---|---|---|
| Thiel Jacob M | -- | -- | |
| Sssdlt Farms Llc | -- | -- | |
| Sssdlt Farms Llc | -- | None Listed On Document | |
| Thiel Shannon M | -- | -- |
Source: Public Records
Mortgage History
| Date | Status | Borrower | Loan Amount |
|---|---|---|---|
| Open | Thiel Jacob M | $70,000 |
Source: Public Records
Tax History Compared to Growth
Tax History
| Year | Tax Paid | Tax Assessment Tax Assessment Total Assessment is a certain percentage of the fair market value that is determined by local assessors to be the total taxable value of land and additions on the property. | Land | Improvement |
|---|---|---|---|---|
| 2024 | $586 | $19,280 | $1,830 | $17,450 |
| 2023 | $586 | $19,280 | $1,830 | $17,450 |
| 2022 | $586 | $17,530 | $1,660 | $15,870 |
| 2021 | $279 | $17,530 | $1,660 | $15,870 |
| 2020 | $279 | $17,530 | $1,660 | $15,870 |
| 2019 | $278 | $17,530 | $1,660 | $15,870 |
| 2018 | $98 | $11,920 | $1,450 | $10,470 |
| 2017 | $100 | $11,920 | $1,450 | $10,470 |
| 2016 | $95 | $11,920 | $1,450 | $10,470 |
| 2015 | -- | $11,760 | $1,450 | $10,310 |
| 2014 | -- | $11,760 | $1,450 | $10,310 |
| 2013 | -- | $11,760 | $1,450 | $10,310 |
Source: Public Records
Map
Nearby Homes
- 11650 Township Highway 103
- 14319 County Highway 64
- 381 & 383 W Johnson St
- US 30 Sr 23
- 203 203 1/2 E Crawford St
- 221&221 1/2 S 7th St
- 0 State Highway 53 Unit 6132082
- 15418 Ohio 37
- 14943 Township Highway 44
- 379 Spring St
- 225 S Hazel St
- 18205 County Highway 96
- 346 W Hicks St
- 18579 Township Road 49
- 18579 Township Highway 49
- 386 W Finley St
- 602 S 7th St
- 326 S 8th St
- 454 N Sandusky Ave
- 430 S Sandusky Ave
- 14207 State Highway 53 W
- 14277 State Highway 53 W
- 14391 State Highway 53 W
- 13966 State Highway 53 W
- 13966 State Highway 53 W
- 13966 Ohio 53
- 12782 County Highway 97
- 14525 State Highway 53 W
- 12742 County Highway 97
- 13742 Ohio 53
- 13742 State Hwy 53 W
- 14650 State Highway 53 W
- 13739 State Highway 53 W
- 13728 State Highway 53 W
- 12542 County Highway 97
- 14739 State Highway 53 W
- 13567 State Highway 53 W
- 14850 State Highway 53 W
- 13539 State Highway 53 W
- 12387 County Highway 97