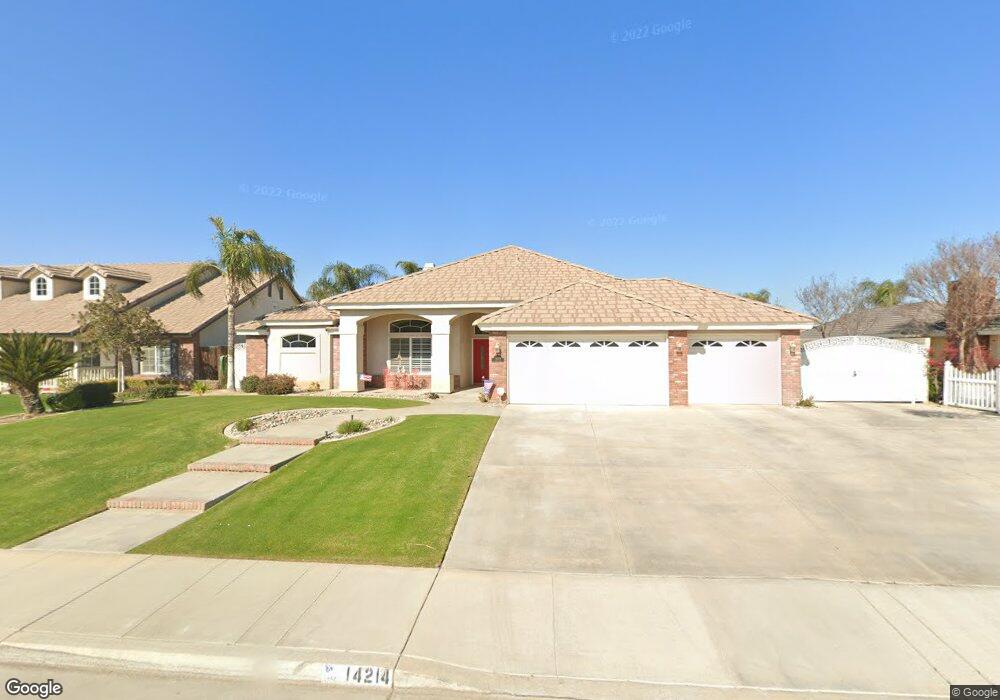
14214 Table Rock Ave Bakersfield, CA 93314
Estimated Value: $645,822 - $740,000
4
Beds
3
Baths
2,746
Sq Ft
$256/Sq Ft
Est. Value
About This Home
This home is located at 14214 Table Rock Ave, Bakersfield, CA 93314 and is currently estimated at $701,956, approximately $255 per square foot. 14214 Table Rock Ave is a home located in Kern County with nearby schools including Patriot Elementary School, Freedom Middle School, and Frontier High School.
Ownership History
Date
Name
Owned For
Owner Type
Purchase Details
Closed on
Jun 26, 2024
Sold by
Walker Judy W and Walker Alan Paul
Bought by
Aj Walker Family Trust and Walker
Current Estimated Value
Purchase Details
Closed on
Feb 28, 2023
Sold by
Walker Judy W
Bought by
Walker Judy W and Walker Alan Paul
Purchase Details
Closed on
Sep 6, 2012
Sold by
Shumaker Ronald L
Bought by
Shumaker Judy W
Home Financials for this Owner
Home Financials are based on the most recent Mortgage that was taken out on this home.
Original Mortgage
$100,000
Interest Rate
3.5%
Mortgage Type
New Conventional
Purchase Details
Closed on
Sep 3, 2002
Sold by
Rosedale Builders Inc
Bought by
Shumaker Ronald L and Shumaker Judy W
Home Financials for this Owner
Home Financials are based on the most recent Mortgage that was taken out on this home.
Original Mortgage
$145,000
Interest Rate
6.37%
Create a Home Valuation Report for This Property
The Home Valuation Report is an in-depth analysis detailing your home's value as well as a comparison with similar homes in the area
Home Values in the Area
Average Home Value in this Area
Purchase History
| Date | Buyer | Sale Price | Title Company |
|---|---|---|---|
| Aj Walker Family Trust | -- | None Listed On Document | |
| Walker Judy W | -- | -- | |
| Shumaker Judy W | -- | Chicago Title Company | |
| Shumaker Ronald L | $275,000 | First American Title Co |
Source: Public Records
Mortgage History
| Date | Status | Borrower | Loan Amount |
|---|---|---|---|
| Previous Owner | Shumaker Judy W | $100,000 | |
| Previous Owner | Shumaker Ronald L | $145,000 |
Source: Public Records
Tax History Compared to Growth
Tax History
| Year | Tax Paid | Tax Assessment Tax Assessment Total Assessment is a certain percentage of the fair market value that is determined by local assessors to be the total taxable value of land and additions on the property. | Land | Improvement |
|---|---|---|---|---|
| 2025 | $5,335 | $394,267 | $86,889 | $307,378 |
| 2024 | $5,335 | $386,537 | $85,186 | $301,351 |
| 2023 | $5,187 | $378,959 | $83,516 | $295,443 |
| 2022 | $5,082 | $371,531 | $81,879 | $289,652 |
| 2021 | $4,964 | $364,248 | $80,274 | $283,974 |
| 2020 | $4,896 | $360,516 | $79,451 | $281,065 |
| 2019 | $4,924 | $360,516 | $79,451 | $281,065 |
| 2018 | $4,708 | $346,521 | $76,367 | $270,154 |
| 2017 | $4,699 | $339,728 | $74,870 | $264,858 |
| 2016 | $4,256 | $333,068 | $73,402 | $259,666 |
| 2015 | $4,213 | $328,067 | $72,300 | $255,767 |
| 2014 | $4,120 | $321,642 | $70,884 | $250,758 |
Source: Public Records
Map
Nearby Homes
- 14012 Cedar Creek Ave
- 14014 Santa fe Ct
- 14631 Blue Stream Ave
- 14508 Plumeria Ct
- 13946 Santa fe Ct
- 3849 Jenkins Rd
- 3616 Three Bars St
- 14822 Plumeria Ct
- 12403 Hageman Rd
- 12701 Hageman Rd
- 14507 Evadell Ct
- 3611 Jenkins Rd
- 15031 Rye Field Dr
- 3408 Shauna Marie St
- 13602 Philip Phelps Ave
- 15002 Southernwood Ave
- 13615 Velma Pearl Way
- 14301 Shady Tree Ct
- 14300 Shady Tree Ct
- 13507 Velma Pearl Way
- 14232 Table Rock Ave
- 14162 Table Rock Ave
- 14252 Table Rock Ave
- 14229 Cedar Creek Ave
- 14159 Cedar Creek Ave
- 14142 Table Rock Ave
- 14215 Table Rock Ave
- 14233 Table Rock Ave
- 14249 Cedar Creek Ave
- 14163 Table Rock Ave
- 14139 Cedar Creek Ave
- 14306 Table Rock Ave
- 14253 Table Rock Ave
- 14124 Table Rock Ave
- 14143 Table Rock Ave Unit 2
- 14303 Cedar Creek Ave
- 14307 Table Rock Ave Unit 2
- 14121 Cedar Creek Ave
- 14324 Table Rock Ave Unit 2
- 14125 Table Rock Ave