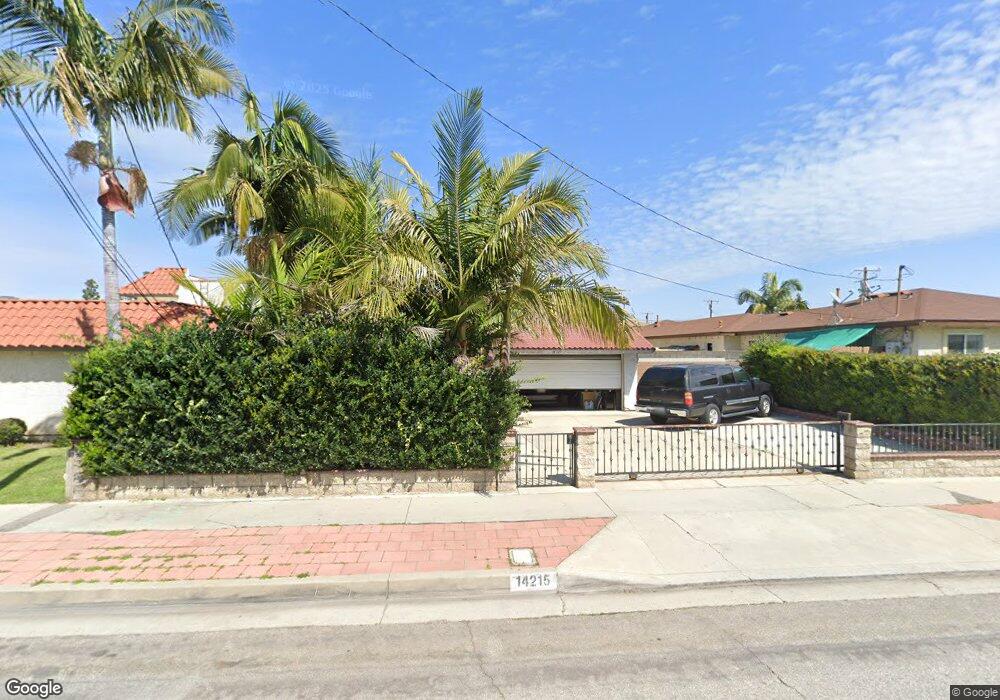
14215 Broadway Whittier, CA 90604
South Whittier NeighborhoodEstimated Value: $764,181 - $854,000
3
Beds
2
Baths
1,407
Sq Ft
$567/Sq Ft
Est. Value
About This Home
This home is located at 14215 Broadway, Whittier, CA 90604 and is currently estimated at $798,045, approximately $567 per square foot. 14215 Broadway is a home located in Los Angeles County with nearby schools including Ceres Elementary School, Hillview Middle School, and California High School.
Ownership History
Date
Name
Owned For
Owner Type
Purchase Details
Closed on
Jul 11, 2000
Sold by
Odonnell Ryan B and Odonnell Shauna
Bought by
Cay Dean Oliver Evangelio and Cay Majeeda P M Lachica
Current Estimated Value
Home Financials for this Owner
Home Financials are based on the most recent Mortgage that was taken out on this home.
Original Mortgage
$184,970
Outstanding Balance
$66,048
Interest Rate
8.2%
Mortgage Type
FHA
Estimated Equity
$731,997
Purchase Details
Closed on
Apr 27, 2000
Sold by
Burney Thomas R and Burney David C
Bought by
Odonnell Ryan B and Odonnell Shauna
Home Financials for this Owner
Home Financials are based on the most recent Mortgage that was taken out on this home.
Original Mortgage
$133,700
Interest Rate
8.25%
Purchase Details
Closed on
Dec 16, 1998
Sold by
Burney Nancy Tr Burney Trust
Bought by
Burney Nancy C and Burney Thomas R
Create a Home Valuation Report for This Property
The Home Valuation Report is an in-depth analysis detailing your home's value as well as a comparison with similar homes in the area
Home Values in the Area
Average Home Value in this Area
Purchase History
| Date | Buyer | Sale Price | Title Company |
|---|---|---|---|
| Cay Dean Oliver Evangelio | $186,500 | Fidelity Title | |
| Odonnell Ryan B | $150,000 | North American Title Co | |
| Burney Nancy C | -- | -- |
Source: Public Records
Mortgage History
| Date | Status | Borrower | Loan Amount |
|---|---|---|---|
| Open | Cay Dean Oliver Evangelio | $184,970 | |
| Previous Owner | Odonnell Ryan B | $133,700 |
Source: Public Records
Tax History
| Year | Tax Paid | Tax Assessment Tax Assessment Total Assessment is a certain percentage of the fair market value that is determined by local assessors to be the total taxable value of land and additions on the property. | Land | Improvement |
|---|---|---|---|---|
| 2025 | $3,758 | $281,002 | $168,755 | $112,247 |
| 2024 | $3,758 | $275,494 | $165,447 | $110,047 |
| 2023 | $3,698 | $270,093 | $162,203 | $107,890 |
| 2022 | $3,621 | $264,798 | $159,023 | $105,775 |
| 2021 | $3,550 | $259,606 | $155,905 | $103,701 |
| 2019 | $3,481 | $251,908 | $151,282 | $100,626 |
| 2018 | $3,261 | $246,969 | $148,316 | $98,653 |
| 2016 | $3,083 | $237,380 | $142,557 | $94,823 |
| 2015 | $3,063 | $233,815 | $140,416 | $93,399 |
| 2014 | $3,027 | $229,236 | $137,666 | $91,570 |
Source: Public Records
Map
Nearby Homes
- 14255 Broadway
- 14308 Broadway
- 10241 Ruoff Ave
- 14315 Broadway Unit 210
- 14030 Dicky St
- 10035 Ben Hur Ave
- 14548 Hawes St
- 14056 Hawes St
- 14657 Via Pointe Del Sol
- 13838 Cornishcrest Rd
- 13814 Mystic St
- 13822 Cornishcrest Rd
- 10415 Valley View Ave
- 11037 Biella Way
- 10745 Victoria Ave Unit 70
- 10745 Victoria Ave Unit 4
- 10529 Corley Dr
- 10344 Parise Dr
- 14015 Lausanne Ct
- 13751 Bentongrove Dr
- 14221 Broadway
- 14225 Broadway
- 14165 Broadway
- 14235 Broadway
- 14222 Broadway
- 10202 Victoria Ave
- 14161 Broadway
- 10209 Elmore Ave
- 14241 Broadway
- 10208 Victoria Ave
- 14155 Broadway
- 10202 Elmore Ave
- 10215 Elmore Ave
- 14151 Broadway
- 10332 1/2 Victoria Ave
- 10334 1/4 Victoria Ave
- 10334 1/2 Victoria Ave
- 10208 Elmore Ave
- 10205 Victoria Ave
- 14117 Broadway
Your Personal Tour Guide
Ask me questions while you tour the home.