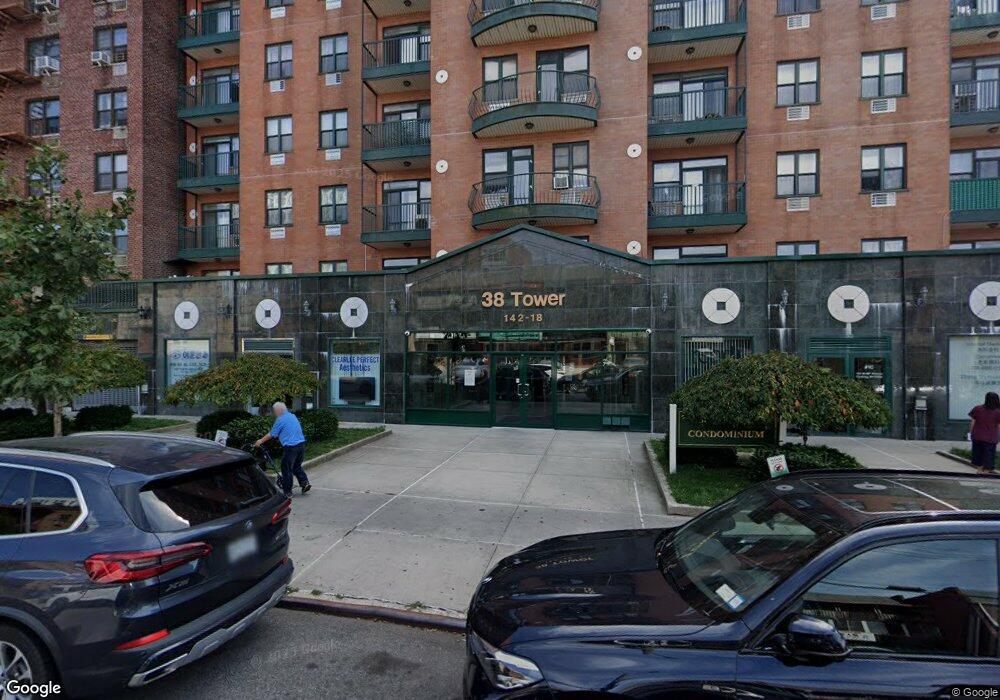
14218 38th Ave Unit 2D Flushing, NY 11354
Flushing-Willets Point NeighborhoodEstimated Value: $611,727 - $708,000
2
Beds
2
Baths
824
Sq Ft
$817/Sq Ft
Est. Value
About This Home
This home is located at 14218 38th Ave Unit 2D, Flushing, NY 11354 and is currently estimated at $673,182, approximately $816 per square foot. 14218 38th Ave Unit 2D is a home located in Queens County with nearby schools including P.S. 79 - Francis Lewis, J.H.S. 194 William Carr, and Flushing High School.
Ownership History
Date
Name
Owned For
Owner Type
Purchase Details
Closed on
Nov 27, 2018
Sold by
Wu Andy
Bought by
Wang Jie and Xu Shu
Current Estimated Value
Purchase Details
Closed on
Jun 28, 2018
Sold by
Castle Peak 2012-1 Loan Trust Mortgage B and U S Bank National Association (Indentur
Bought by
Wu Andy
Purchase Details
Closed on
Jun 26, 2015
Sold by
Bruszewski Esq As Referee Nicole L
Bought by
Castle Peak 2012-1 Loan Trust Mortgage B and U S Bank National Association As Indent
Purchase Details
Closed on
Mar 26, 2004
Sold by
38 Tower Llc
Bought by
Pak Young M
Home Financials for this Owner
Home Financials are based on the most recent Mortgage that was taken out on this home.
Original Mortgage
$284,000
Interest Rate
5.6%
Mortgage Type
Purchase Money Mortgage
Create a Home Valuation Report for This Property
The Home Valuation Report is an in-depth analysis detailing your home's value as well as a comparison with similar homes in the area
Home Values in the Area
Average Home Value in this Area
Purchase History
| Date | Buyer | Sale Price | Title Company |
|---|---|---|---|
| Wang Jie | $570,000 | -- | |
| Wu Andy | $544,764 | -- | |
| Castle Peak 2012-1 Loan Trust Mortgage B | $456,059 | -- | |
| Pak Young M | $359,970 | -- |
Source: Public Records
Mortgage History
| Date | Status | Borrower | Loan Amount |
|---|---|---|---|
| Previous Owner | Pak Young M | $284,000 |
Source: Public Records
Tax History
| Year | Tax Paid | Tax Assessment Tax Assessment Total Assessment is a certain percentage of the fair market value that is determined by local assessors to be the total taxable value of land and additions on the property. | Land | Improvement |
|---|---|---|---|---|
| 2025 | $5,992 | $47,086 | $962 | $46,124 |
| 2024 | $4,308 | $47,930 | $962 | $46,968 |
| 2023 | $4,754 | $53,904 | $962 | $52,942 |
| 2022 | $4,654 | $50,718 | $962 | $49,756 |
| 2021 | $6,456 | $52,631 | $962 | $51,669 |
| 2020 | $7,020 | $59,760 | $962 | $58,798 |
| 2019 | $6,784 | $61,634 | $962 | $60,672 |
| 2018 | $5,174 | $50,402 | $946 | $49,456 |
| 2017 | $3,717 | $47,515 | $925 | $46,590 |
| 2016 | $2,481 | $47,515 | $925 | $46,590 |
| 2015 | $181 | $43,587 | $911 | $42,676 |
| 2014 | $181 | $41,226 | $927 | $40,299 |
Source: Public Records
Map
Nearby Homes
- 14218 38th Ave Unit 9C
- 142-38 37th Ave Unit 6A
- 142-38 37th Ave Unit 13C
- 142-38 37th Ave Unit 4A
- 14225 37th Ave Unit 7C
- 14238 37th Ave Unit 11D
- 14238 37th Ave Unit 6H
- 14238 37th Ave Unit 4C
- 14238 37th Ave Unit 9F
- 142-29 37th Ave Unit 5
- 14205 Roosevelt Ave Unit 339
- 14205 Roosevelt Ave Unit 4
- 13835 39th Ave Unit 17M
- 13835 39th Ave Unit 12L
- 13835 39th Ave Unit 12F
- 142-05 Roosevelt Ave Unit 331
- 142-05 Roosevelt Ave Unit 415
- 142-05 Roosevelt Ave Unit 721
- 142-05 Roosevelt Ave Unit 328
- 142-05 Roosevelt Ave Unit 539
- 14218 38th Ave Unit 8G
- 14218 38th Ave Unit C5
- 14218 38th Ave Unit 9D
- 14218 38th Ave Unit 6D
- 14218 38th Ave Unit 7C
- 142-18 38th Ave Unit 7D
- 142-18 38th Ave Unit 2D
- 142-18 38th Ave Unit 6D
- 142-18 38th Ave Unit 7A
- 142-18 38th Ave Unit 9C
- 142-18 38th Ave Unit C5
- 142-18 38th Ave Unit 9G
- 142-18 38th Ave Unit 5C
- 142-18 38th Ave Unit 8G
- 142-18 38th Ave Unit 2Floor
- 14218 38th Ave Unit 6A
- 14218 38th Ave Unit 10D
- 14218 38th Ave Unit 10C
- 14218 38th Ave Unit 10B
- 14218 38th Ave Unit 10A
Your Personal Tour Guide
Ask me questions while you tour the home.