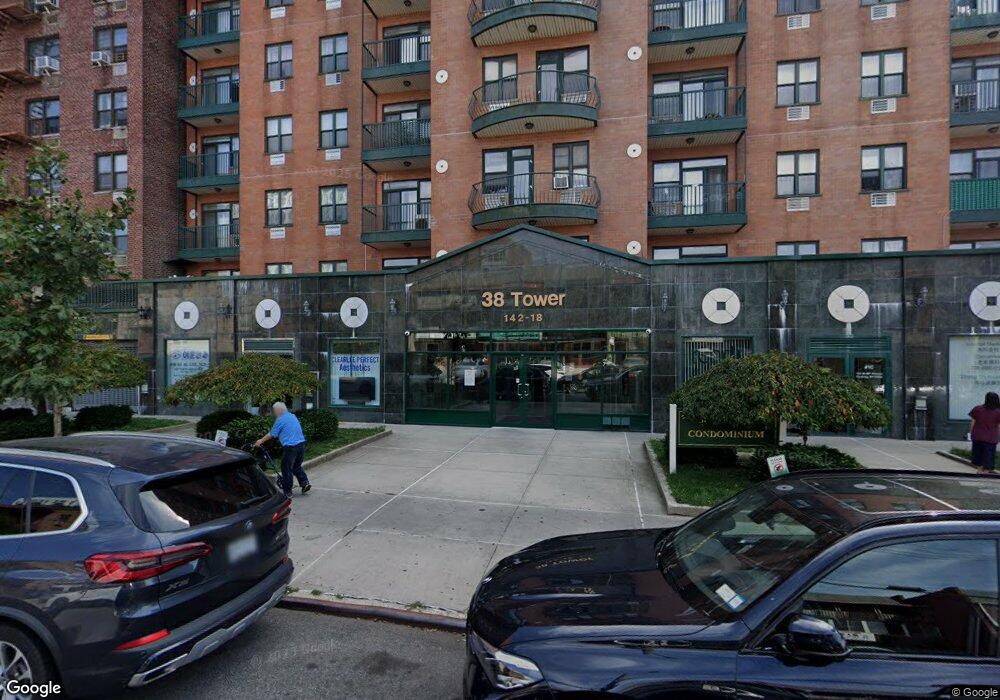
14218 38th Ave Unit 8G Flushing, NY 11354
Flushing NeighborhoodEstimated Value: $537,702 - $705,000
2
Beds
2
Baths
800
Sq Ft
$804/Sq Ft
Est. Value
About This Home
This home is located at 14218 38th Ave Unit 8G, Flushing, NY 11354 and is currently estimated at $643,426, approximately $804 per square foot. 14218 38th Ave Unit 8G is a home located in Queens County with nearby schools including P.S. 79 - Francis Lewis, J.H.S. 194 William Carr, and Flushing High School.
Ownership History
Date
Name
Owned For
Owner Type
Purchase Details
Closed on
Nov 2, 2021
Sold by
Gu Shen Shen and Xu Li Hong
Bought by
Chan Jeffery and Chen Feng
Current Estimated Value
Home Financials for this Owner
Home Financials are based on the most recent Mortgage that was taken out on this home.
Original Mortgage
$170,000
Outstanding Balance
$155,536
Interest Rate
2.88%
Mortgage Type
Purchase Money Mortgage
Estimated Equity
$487,890
Purchase Details
Closed on
Jun 8, 2010
Sold by
Lee Hee Ja and Lim Mun Jung
Bought by
Gu Shen Shen and Xu Li Hong
Purchase Details
Closed on
Aug 12, 2004
Sold by
38 Tower Llc
Bought by
Lee Hee Ja and Lim Mun Jung
Home Financials for this Owner
Home Financials are based on the most recent Mortgage that was taken out on this home.
Original Mortgage
$150,000
Interest Rate
6.02%
Mortgage Type
Purchase Money Mortgage
Create a Home Valuation Report for This Property
The Home Valuation Report is an in-depth analysis detailing your home's value as well as a comparison with similar homes in the area
Home Values in the Area
Average Home Value in this Area
Purchase History
| Date | Buyer | Sale Price | Title Company |
|---|---|---|---|
| Chan Jeffery | $643,888 | -- | |
| Gu Shen Shen | $389,000 | -- | |
| Lee Hee Ja | $358,692 | -- |
Source: Public Records
Mortgage History
| Date | Status | Borrower | Loan Amount |
|---|---|---|---|
| Open | Chan Jeffery | $170,000 | |
| Previous Owner | Lee Hee Ja | $150,000 |
Source: Public Records
Tax History Compared to Growth
Tax History
| Year | Tax Paid | Tax Assessment Tax Assessment Total Assessment is a certain percentage of the fair market value that is determined by local assessors to be the total taxable value of land and additions on the property. | Land | Improvement |
|---|---|---|---|---|
| 2025 | $5,161 | $40,552 | $828 | $39,724 |
| 2024 | $5,161 | $41,280 | $828 | $40,452 |
| 2023 | $5,804 | $46,425 | $828 | $45,597 |
| 2022 | $4,008 | $43,681 | $828 | $42,853 |
| 2021 | $5,561 | $45,329 | $828 | $44,501 |
| 2020 | $6,046 | $51,468 | $828 | $50,640 |
| 2019 | $5,843 | $53,083 | $828 | $52,255 |
| 2018 | $4,456 | $43,409 | $814 | $42,595 |
| 2017 | $3,202 | $40,925 | $795 | $40,130 |
| 2016 | $2,137 | $40,925 | $795 | $40,130 |
| 2015 | $156 | $37,539 | $784 | $36,755 |
| 2014 | $156 | $35,506 | $798 | $34,708 |
Source: Public Records
Map
Nearby Homes
- 142-28 37th Ave Unit 3B
- 142-18 38th Ave Unit 3G
- 142-38 37th Ave Unit 8B
- 142-38 37th Ave Unit 5A
- 142-38 37th Ave Unit 3G
- 14238 37th Ave
- 36-41 Union St Unit 4G
- 14205 Roosevelt Ave Unit 602
- 13835 39th Ave Unit 14M
- 13835 39th Ave Unit 17M
- 142-05 Roosevelt Ave Unit 521
- 142-05 Roosevelt Ave Unit 204
- 142-05 Roosevelt Ave Unit 310
- 142-05 Roosevelt Ave Unit 627
- 142-05 Roosevelt Ave Unit 328
- 142-05 Roosevelt Ave Unit 415
- 142-05 Roosevelt Ave Unit 721
- 142-05 Roosevelt Ave Unit 517
- 142-05 Roosevelt Ave Unit 301
- 142-05 Roosevelt Ave Unit 331
- 14218 38th Ave Unit C5
- 14218 38th Ave Unit 9D
- 14218 38th Ave Unit 2D
- 14218 38th Ave Unit 6D
- 14218 38th Ave Unit 7C
- 142-18 38th Ave Unit 7D
- 142-18 38th Ave Unit 2D
- 142-18 38th Ave Unit 6D
- 142-18 38th Ave Unit 7A
- 142-18 38th Ave Unit 9C
- 142-18 38th Ave Unit C5
- 142-18 38th Ave Unit 9G
- 142-18 38th Ave Unit 5C
- 142-18 38th Ave Unit 8G
- 142-18 38th Ave Unit 2Floor
- 14218 38th Ave Unit 6A
- 14218 38th Ave Unit 10D
- 14218 38th Ave Unit 10C
- 14218 38th Ave Unit 10B
- 14218 38th Ave Unit 10A