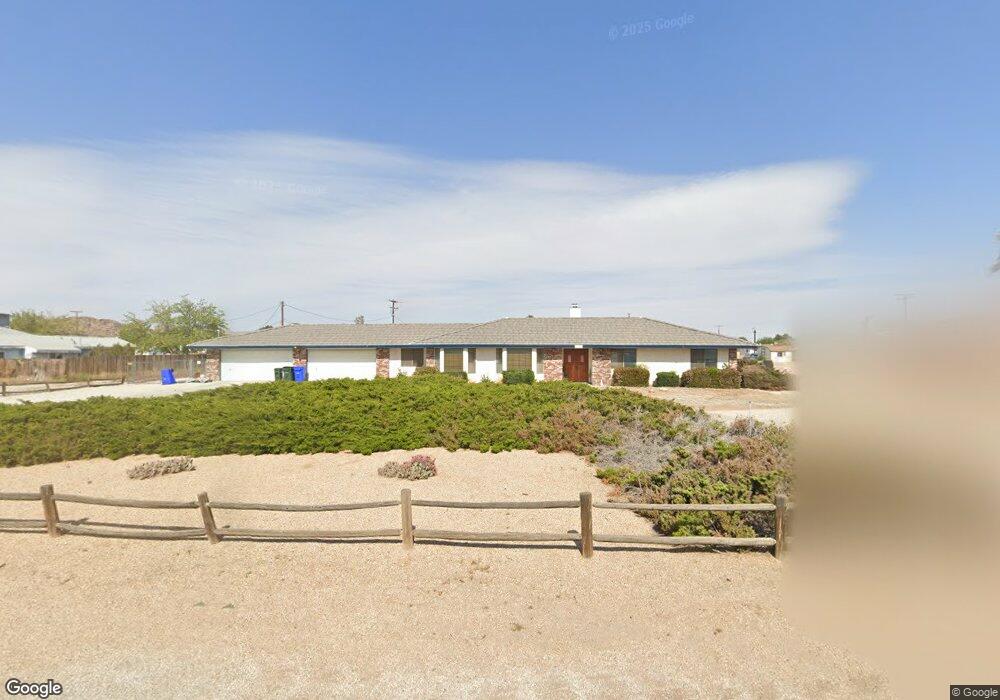
14219 Santee Rd Apple Valley, CA 92307
High Desert NeighborhoodEstimated Value: $523,728 - $596,000
4
Beds
2
Baths
2,565
Sq Ft
$220/Sq Ft
Est. Value
About This Home
This home is located at 14219 Santee Rd, Apple Valley, CA 92307 and is currently estimated at $565,182, approximately $220 per square foot. 14219 Santee Rd is a home located in San Bernardino County with nearby schools including Rio Vista School of Applied Learning, Granite Hills High School, and Apple Valley Christian.
Ownership History
Date
Name
Owned For
Owner Type
Purchase Details
Closed on
Dec 12, 2016
Sold by
Lynn Vanstralen Eric
Bought by
Lynn Vanstralen Eric and Lynn Van Stralen Diane
Current Estimated Value
Purchase Details
Closed on
May 3, 2016
Sold by
Anthony Diane Charlotte
Bought by
Lynn Vanstralen Eric and Lynn Van Stralen Diane
Purchase Details
Closed on
Sep 23, 2015
Sold by
Anthony Diane Charlotte
Bought by
Anthony Diane Charlotte and Williams John Lee
Purchase Details
Closed on
Mar 12, 2014
Sold by
Jackson Charlotte C
Bought by
Jackson Charlotte C and Jackson Anthony Dianne
Purchase Details
Closed on
Mar 8, 2000
Sold by
Jackson Family Trust
Bought by
Jackson Charlotte C and Trust B Of The Jackson Family
Purchase Details
Closed on
Jul 10, 1995
Sold by
Jackson Bernard B
Bought by
Jackson Bernrad B and Jackson Charlotte C
Create a Home Valuation Report for This Property
The Home Valuation Report is an in-depth analysis detailing your home's value as well as a comparison with similar homes in the area
Home Values in the Area
Average Home Value in this Area
Purchase History
| Date | Buyer | Sale Price | Title Company |
|---|---|---|---|
| Lynn Vanstralen Eric | -- | None Available | |
| Lynn Vanstralen Eric | $279,000 | Chicago Title Inland Empire | |
| Anthony Diane Charlotte | -- | Chicago Title Inland Empire | |
| Anthony Diane Charlotte | -- | None Available | |
| Jackson Charlotte C | -- | None Available | |
| Jackson Charlotte C | -- | -- | |
| Jackson Bernrad B | -- | -- |
Source: Public Records
Tax History
| Year | Tax Paid | Tax Assessment Tax Assessment Total Assessment is a certain percentage of the fair market value that is determined by local assessors to be the total taxable value of land and additions on the property. | Land | Improvement |
|---|---|---|---|---|
| 2025 | $3,780 | $330,280 | $59,191 | $271,089 |
| 2024 | $3,671 | $323,804 | $58,030 | $265,774 |
| 2023 | $3,637 | $317,455 | $56,892 | $260,563 |
| 2022 | $3,581 | $311,230 | $55,776 | $255,454 |
| 2021 | $3,497 | $305,127 | $54,682 | $250,445 |
| 2020 | $3,455 | $301,998 | $54,121 | $247,877 |
| 2019 | $3,390 | $296,077 | $53,060 | $243,017 |
| 2018 | $3,305 | $290,272 | $52,020 | $238,252 |
| 2017 | $3,258 | $284,580 | $51,000 | $233,580 |
| 2016 | $3,197 | $277,045 | $51,523 | $225,522 |
| 2015 | -- | $270,953 | $71,951 | $199,002 |
| 2014 | $3,036 | $265,646 | $70,542 | $195,104 |
Source: Public Records
Map
Nearby Homes
- 14265 Santee Rd
- 14416 Ricaree Rd
- 20401 Tonawanda Rd
- 14057 Crow Rd
- 20376 Tonawanda Rd
- 13934 Okesa Rd
- 14024 Delaware Rd
- 19891 Talihina Rd
- 14305 Bochee Rd
- 20572 Rancherias Rd
- 20430 Rancherias Rd
- 20635 Tonawanda Rd
- 19804 Haida Rd
- 14355 Bochee Rd
- 19801 Talihina Rd
- 13954 Cronese Rd
- 0 Choco Rd Unit HD24105766
- 14415 Erie Rd
- 19655 Seneca Rd
- 14498 Savannah Ct
- 14243 Santee Rd
- 14205 Santee Rd
- 14230 Cree Rd
- 14204 Cree Rd
- 14222 Santee Rd
- 20230 Shoshonee Rd
- 20210 Shoshonee Rd
- 14240 Cree Rd
- 14204 Santee Rd
- 14246 Santee Rd
- 20250 Shoshonee Rd
- 14295 Santee Rd
- 14176 Santee Rd
- 14270 Santee Rd
- 20260 Shoshonee Rd
- 14180 Cree Rd
- 14320 Ricaree Rd
- 14270 Cree Rd
- 20160 Shoshonee Rd
- 14290 Santee Rd Unit 6
Your Personal Tour Guide
Ask me questions while you tour the home.