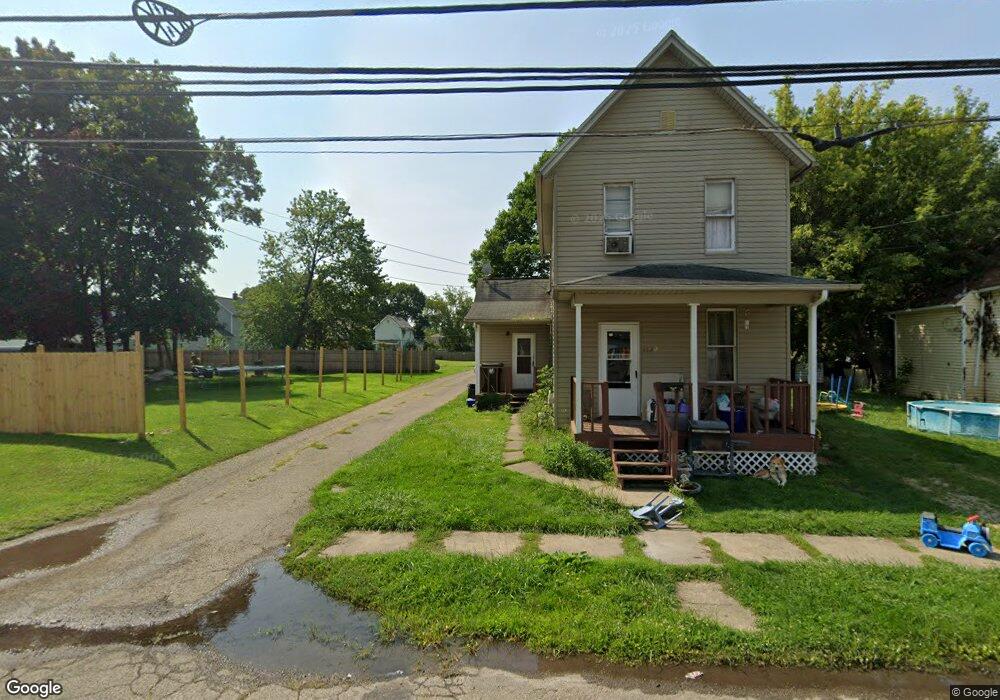
1422 4th St NE Canton, OH 44704
Crystal Park NeighborhoodEstimated Value: $19,000 - $89,000
2
Beds
1
Bath
1,102
Sq Ft
$60/Sq Ft
Est. Value
About This Home
This home is located at 1422 4th St NE, Canton, OH 44704 and is currently estimated at $66,320, approximately $60 per square foot. 1422 4th St NE is a home located in Stark County with nearby schools including Stephanie Rushin Patrick Elementary School, Early Learning Center @ Schreiber, and McKinley High School.
Ownership History
Date
Name
Owned For
Owner Type
Purchase Details
Closed on
Aug 7, 2025
Sold by
Kanam John M
Bought by
Nice City Homes Llc
Current Estimated Value
Purchase Details
Closed on
Feb 14, 2025
Sold by
Kell Michael
Bought by
Kanam John M
Purchase Details
Closed on
Dec 6, 2024
Sold by
Waggoner Connie E
Bought by
Kell Michael
Purchase Details
Closed on
Mar 14, 2003
Sold by
Evans Norman T
Bought by
Waggoner Robert D and Waggoner Connie E
Home Financials for this Owner
Home Financials are based on the most recent Mortgage that was taken out on this home.
Original Mortgage
$26,400
Interest Rate
8.75%
Mortgage Type
Purchase Money Mortgage
Purchase Details
Closed on
Mar 21, 2002
Sold by
Lucas Ronald L
Bought by
Evans Norman T
Purchase Details
Closed on
Aug 25, 1997
Sold by
Devance Ida J
Bought by
Lucas Ronald L
Create a Home Valuation Report for This Property
The Home Valuation Report is an in-depth analysis detailing your home's value as well as a comparison with similar homes in the area
Home Values in the Area
Average Home Value in this Area
Purchase History
| Date | Buyer | Sale Price | Title Company |
|---|---|---|---|
| Nice City Homes Llc | $21,800 | None Listed On Document | |
| Kanam John M | $52,500 | None Listed On Document | |
| Kell Michael | $22,000 | None Listed On Document | |
| Waggoner Robert D | $33,000 | -- | |
| Evans Norman T | $8,100 | -- | |
| Lucas Ronald L | $7,000 | -- |
Source: Public Records
Mortgage History
| Date | Status | Borrower | Loan Amount |
|---|---|---|---|
| Previous Owner | Waggoner Robert D | $26,400 | |
| Closed | Waggoner Robert D | $6,600 |
Source: Public Records
Tax History
| Year | Tax Paid | Tax Assessment Tax Assessment Total Assessment is a certain percentage of the fair market value that is determined by local assessors to be the total taxable value of land and additions on the property. | Land | Improvement |
|---|---|---|---|---|
| 2025 | $770 | $15,260 | $1,750 | $13,510 |
| 2024 | -- | $15,260 | $1,750 | $13,510 |
| 2023 | $394 | $6,440 | $1,260 | $5,180 |
| 2022 | $193 | $6,440 | $1,260 | $5,180 |
| 2021 | $391 | $6,440 | $1,260 | $5,180 |
| 2020 | $348 | $5,220 | $1,090 | $4,130 |
| 2019 | $305 | $5,220 | $1,090 | $4,130 |
Source: Public Records
Map
Nearby Homes
- 1427 4th St NE
- 1425 5th St NE
- 1316 4th St NE
- 1710 4th St NE
- 0 3rd St SE Unit 5132035
- 515 Flamos Cir NE
- 1855 7th St NE
- 1747 5th St SE
- 319 Crestmont Ave NE
- 429 Gobel Ave NE
- 2227 7th St NE
- 1411 Laiblin Place NE
- 1161 Spring Ave NE
- 1311 Warner Rd SE
- 1322 Struble Ave NE
- 1431 Sherrick Rd SE
- 511 Girard Ave SE
- 1338 Maple Ave NE
- 1525 14th St NE
- 1332 Spring Ave NE
- 1418 4th St NE
- 1416 4th St NE
- 1424 4th St NE
- 1412 4th St NE
- 1419 3rd St NE
- 1427 3rd St NE
- 1434 4th St NE
- 1415 3rd St NE
- 1431 3rd St NE
- 1421 4th St NE
- 1417 4th St NE
- 1435 3rd St NE
- 1413 4th St NE
- 1502 4th St NE
- 410 Janet Ct NE
- 1433 4th St NE
- 1503 3rd St NE
- 316 Young Ave NE
- 310 Young Ave NE
- 310 Young Ave NE
Your Personal Tour Guide
Ask me questions while you tour the home.