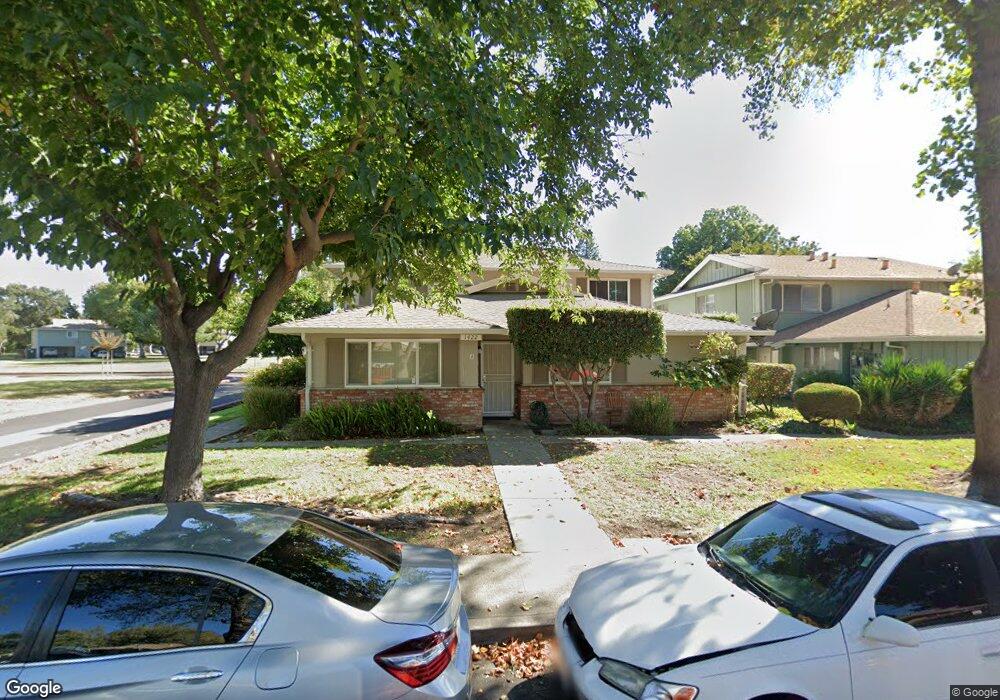
1422 Del Rio Cir Unit A Concord, CA 94518
Tree Haven NeighborhoodEstimated Value: $331,677 - $350,000
2
Beds
1
Bath
861
Sq Ft
$394/Sq Ft
Est. Value
About This Home
This home is located at 1422 Del Rio Cir Unit A, Concord, CA 94518 and is currently estimated at $338,919, approximately $393 per square foot. 1422 Del Rio Cir Unit A is a home located in Contra Costa County with nearby schools including Fair Oaks Elementary School, Oak Grove Middle School, and Ygnacio Valley High School.
Ownership History
Date
Name
Owned For
Owner Type
Purchase Details
Closed on
Feb 7, 2025
Sold by
Velilla Carlos A and Cardenas Clara B
Bought by
Velilla Cardenas Living Trust and Velilla
Current Estimated Value
Purchase Details
Closed on
Jun 6, 2024
Sold by
Valley Oak Irrevocable Trust and Groover David
Bought by
Velilla Carlos and Cardenas Clara B
Purchase Details
Closed on
Feb 4, 2021
Sold by
David And Katherine Groover Family Trust and Groover Katherine Simmonds
Bought by
Valley Oak Irrevocable Trust and Groover
Purchase Details
Closed on
Sep 29, 2008
Sold by
Glenn Tim and Glenn Troy
Bought by
Groover David and Grover Katherine Simmonds
Purchase Details
Closed on
Mar 21, 2008
Sold by
Glenn Tim
Bought by
Glenn Tim and Glenn Troy
Create a Home Valuation Report for This Property
The Home Valuation Report is an in-depth analysis detailing your home's value as well as a comparison with similar homes in the area
Home Values in the Area
Average Home Value in this Area
Purchase History
| Date | Buyer | Sale Price | Title Company |
|---|---|---|---|
| Velilla Cardenas Living Trust | -- | None Listed On Document | |
| Velilla Carlos | $350,000 | Chicago Title | |
| Valley Oak Irrevocable Trust | -- | None Listed On Document | |
| Groover David | $126,000 | Commonwealth Land Title Co | |
| Glenn Tim | -- | None Available |
Source: Public Records
Tax History
| Year | Tax Paid | Tax Assessment Tax Assessment Total Assessment is a certain percentage of the fair market value that is determined by local assessors to be the total taxable value of land and additions on the property. | Land | Improvement |
|---|---|---|---|---|
| 2025 | $4,929 | $357,000 | $255,000 | $102,000 |
| 2024 | $2,691 | $159,063 | $94,681 | $64,382 |
| 2023 | $2,620 | $155,945 | $92,825 | $63,120 |
| 2022 | $2,562 | $152,888 | $91,005 | $61,883 |
| 2021 | $2,481 | $149,891 | $89,221 | $60,670 |
| 2019 | $2,419 | $145,447 | $86,576 | $58,871 |
| 2018 | $2,316 | $142,596 | $84,879 | $57,717 |
| 2017 | $2,224 | $139,801 | $83,215 | $56,586 |
| 2016 | $2,135 | $137,061 | $81,584 | $55,477 |
| 2015 | $2,080 | $135,003 | $80,359 | $54,644 |
| 2014 | $2,015 | $132,359 | $78,785 | $53,574 |
Source: Public Records
Map
Nearby Homes
- 1044 Mohr Ln Unit D
- 1459 Del Rio Cir Unit C
- 1040 Mohr Ln Unit C
- 1465 Del Rio Cir Unit A
- 1369 Del Rio Cir Unit C
- 1064 Mohr Ln Unit C
- 1045 Mohr Ln Unit B
- 1086 Azalea Ln
- 1078 Mohr Ln Unit A
- 1035 Orange St
- 1013 Mohr Ln Unit 2
- 1488 Dumaine St
- 2050 Monument Blvd
- 1023 Bermuda Dr
- 1391 Monument Blvd Unit 20
- 130 Cleopatra Dr
- 1110 Eureka Ln
- 1691 Peach Place
- 1921 Gilly Ln
- 1218 Hookston Rd
- 1422 Del Rio Cir Unit D
- 1422 Del Rio Cir Unit C
- 1422 Del Rio Cir Unit B
- 1416 Del Rio Cir Unit D
- 1416 Del Rio Cir Unit C
- 1416 Del Rio Cir Unit B
- 1416 Del Rio Cir Unit A
- 1417 Del Rio Cir Unit D
- 1417 Del Rio Cir Unit C
- 1417 Del Rio Cir Unit B
- 1417 Del Rio Cir Unit A
- 1410 Del Rio Cir Unit D
- 1410 Del Rio Cir Unit C
- 1410 Del Rio Cir Unit B
- 1410 Del Rio Cir Unit A
- 1434 Del Rio Cir Unit D
- 1434 Del Rio Cir Unit C
- 1434 Del Rio Cir Unit B
- 1434 Del Rio Cir Unit A
- 1411 Del Rio Cir