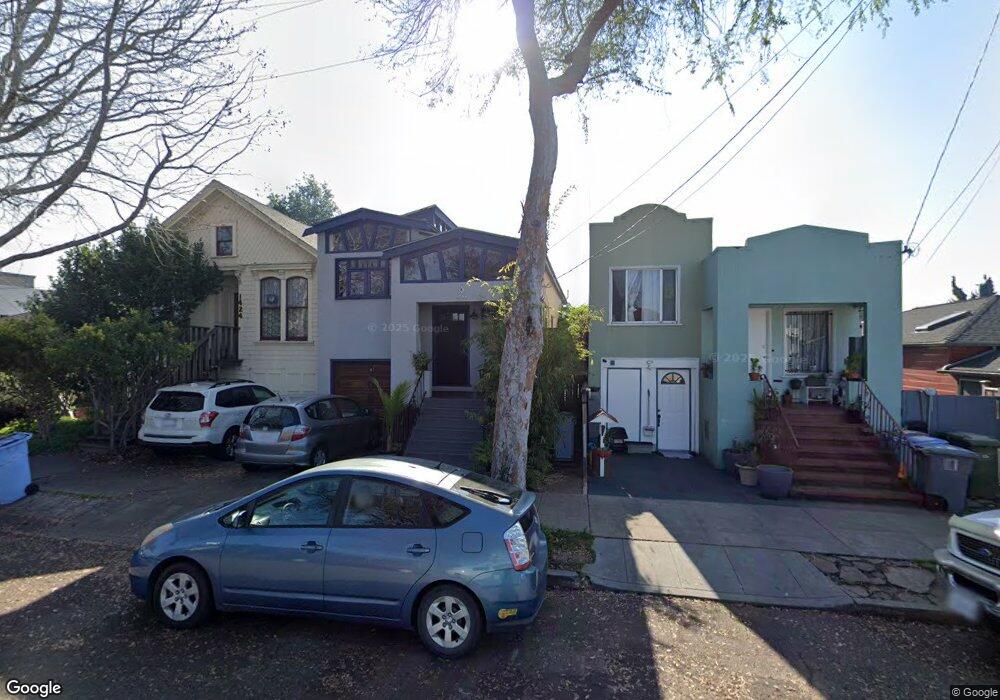
1422 Derby St Berkeley, CA 94702
West Berkeley NeighborhoodEstimated Value: $794,000 - $1,139,000
2
Beds
1
Bath
782
Sq Ft
$1,255/Sq Ft
Est. Value
About This Home
This home is located at 1422 Derby St, Berkeley, CA 94702 and is currently estimated at $981,516, approximately $1,255 per square foot. 1422 Derby St is a home located in Alameda County with nearby schools including Malcolm X Elementary School, Washington Elementary School, and Oxford Elementary School.
Ownership History
Date
Name
Owned For
Owner Type
Purchase Details
Closed on
Feb 27, 2025
Sold by
Orleans Ilo Lawrence and Lagrange Louis Anthony
Bought by
Lagrange-Orleans Trust and Orleans
Current Estimated Value
Purchase Details
Closed on
Dec 1, 2021
Sold by
Lagrange Louis Anthony and Lagrange Louis
Bought by
Lagrange Louis Anthony and Orleans Ilo Lawrence
Home Financials for this Owner
Home Financials are based on the most recent Mortgage that was taken out on this home.
Original Mortgage
$245,000
Interest Rate
3.11%
Mortgage Type
New Conventional
Purchase Details
Closed on
Dec 8, 2009
Sold by
Liu Grace and Andrew L Griffin Living Trust
Bought by
Lagrange Louis
Home Financials for this Owner
Home Financials are based on the most recent Mortgage that was taken out on this home.
Original Mortgage
$404,404
Interest Rate
4.91%
Mortgage Type
New Conventional
Purchase Details
Closed on
Dec 1, 2007
Sold by
Griffin Andrew
Bought by
Liu Grace and Andrew L Griffin Living Trust
Create a Home Valuation Report for This Property
The Home Valuation Report is an in-depth analysis detailing your home's value as well as a comparison with similar homes in the area
Home Values in the Area
Average Home Value in this Area
Purchase History
| Date | Buyer | Sale Price | Title Company |
|---|---|---|---|
| Lagrange-Orleans Trust | -- | None Listed On Document | |
| Lagrange Louis Anthony | -- | Servicelink | |
| Lagrange Louis | $506,000 | Chicago Title Company | |
| Liu Grace | -- | None Available | |
| Griffin Andrew | -- | None Available |
Source: Public Records
Mortgage History
| Date | Status | Borrower | Loan Amount |
|---|---|---|---|
| Previous Owner | Lagrange Louis Anthony | $245,000 | |
| Previous Owner | Lagrange Louis | $404,404 |
Source: Public Records
Tax History
| Year | Tax Paid | Tax Assessment Tax Assessment Total Assessment is a certain percentage of the fair market value that is determined by local assessors to be the total taxable value of land and additions on the property. | Land | Improvement |
|---|---|---|---|---|
| 2025 | $9,996 | $645,463 | $195,674 | $456,789 |
| 2024 | $9,996 | $632,674 | $191,839 | $447,835 |
| 2023 | $9,734 | $627,132 | $188,077 | $439,055 |
| 2022 | $9,513 | $607,839 | $184,391 | $430,448 |
| 2021 | $9,963 | $595,787 | $180,776 | $422,011 |
| 2020 | $9,112 | $596,610 | $178,924 | $417,686 |
| 2019 | $8,830 | $584,913 | $175,416 | $409,497 |
| 2018 | $8,679 | $573,449 | $171,978 | $401,471 |
| 2017 | $8,362 | $562,206 | $168,606 | $393,600 |
| 2016 | $8,127 | $551,186 | $165,301 | $385,885 |
| 2015 | $8,017 | $542,911 | $162,819 | $380,092 |
| 2014 | $7,964 | $532,280 | $159,631 | $372,649 |
Source: Public Records
Map
Nearby Homes
- 1450 Ward St
- 2750 Sacramento St
- 2758 Sacramento St
- 2774 Sacramento St
- 2782 Sacramento St
- 2790 Sacramento St
- 1515 Derby St
- 2717 Mabel St
- 1516 Blake St
- 1516 Blake St Unit A
- 1524 Blake St
- 1612 Parker St
- 2829 California St
- 2437 Acton St
- 2922 Stanton St
- 1604 Dwight Way
- 1634 Blake St
- 1135 Parker St
- 3000 Acton St
- 1726 Parker St Unit 2
Your Personal Tour Guide
Ask me questions while you tour the home.