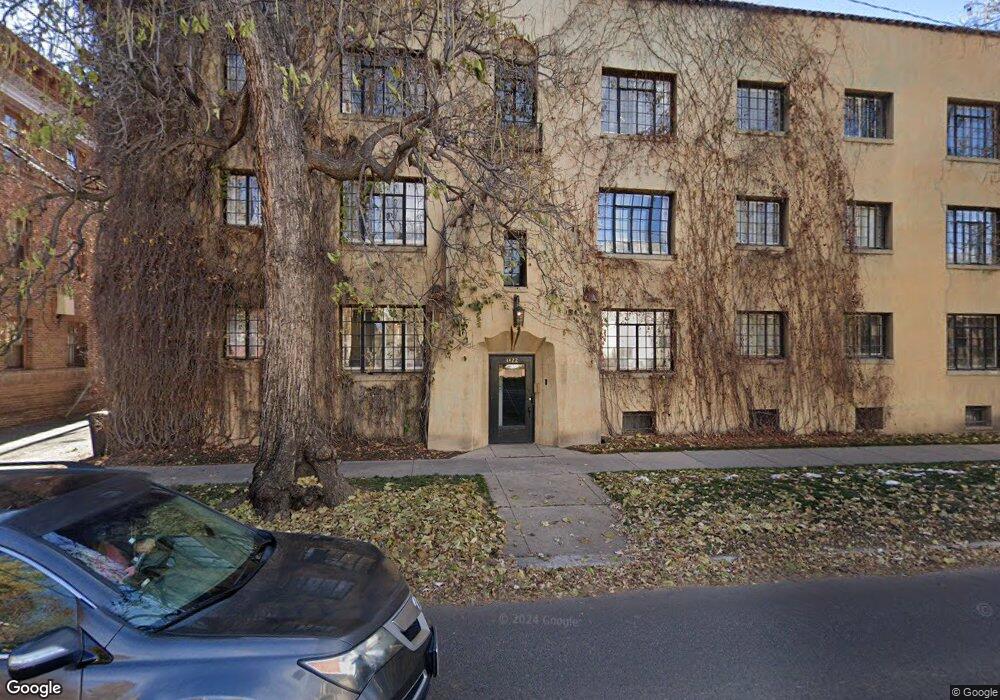
1422 E 8th Ave Unit 10 Denver, CO 80218
Country Club NeighborhoodEstimated Value: $308,000 - $350,000
2
Beds
1
Bath
794
Sq Ft
$408/Sq Ft
Est. Value
About This Home
This home is located at 1422 E 8th Ave Unit 10, Denver, CO 80218 and is currently estimated at $323,840, approximately $407 per square foot. 1422 E 8th Ave Unit 10 is a home located in Denver County with nearby schools including Dora Moore ECE-8 School, Morey Middle School, and East High School.
Ownership History
Date
Name
Owned For
Owner Type
Purchase Details
Closed on
Sep 11, 2012
Sold by
Gudas Megan A
Bought by
Freedman Megan G and Freedman Jeb G
Current Estimated Value
Purchase Details
Closed on
Jul 25, 2003
Sold by
Spalding Aaron C and Lehman Kristin A
Bought by
Gudas Megan A
Home Financials for this Owner
Home Financials are based on the most recent Mortgage that was taken out on this home.
Original Mortgage
$144,000
Interest Rate
5.19%
Mortgage Type
Purchase Money Mortgage
Purchase Details
Closed on
Mar 22, 1999
Sold by
Adams Janis L J
Bought by
Spalding Aaron C and Lehman Kristin A
Home Financials for this Owner
Home Financials are based on the most recent Mortgage that was taken out on this home.
Original Mortgage
$99,900
Interest Rate
6.69%
Mortgage Type
FHA
Create a Home Valuation Report for This Property
The Home Valuation Report is an in-depth analysis detailing your home's value as well as a comparison with similar homes in the area
Home Values in the Area
Average Home Value in this Area
Purchase History
| Date | Buyer | Sale Price | Title Company |
|---|---|---|---|
| Freedman Megan G | -- | None Available | |
| Gudas Megan A | $160,000 | Empire Title & Escrow | |
| Spalding Aaron C | $103,000 | -- |
Source: Public Records
Mortgage History
| Date | Status | Borrower | Loan Amount |
|---|---|---|---|
| Closed | Gudas Megan A | $144,000 | |
| Previous Owner | Spalding Aaron C | $99,900 |
Source: Public Records
Tax History Compared to Growth
Tax History
| Year | Tax Paid | Tax Assessment Tax Assessment Total Assessment is a certain percentage of the fair market value that is determined by local assessors to be the total taxable value of land and additions on the property. | Land | Improvement |
|---|---|---|---|---|
| 2024 | $1,690 | $21,340 | $1,860 | $19,480 |
| 2023 | $1,654 | $21,340 | $1,860 | $19,480 |
| 2022 | $1,777 | $22,350 | $1,930 | $20,420 |
| 2021 | $1,715 | $22,990 | $1,980 | $21,010 |
| 2020 | $1,631 | $21,980 | $1,850 | $20,130 |
| 2019 | $1,585 | $21,980 | $1,850 | $20,130 |
| 2018 | $1,440 | $18,610 | $1,730 | $16,880 |
| 2017 | $1,435 | $18,610 | $1,730 | $16,880 |
| 2016 | $1,397 | $17,130 | $1,616 | $15,514 |
| 2015 | $1,338 | $17,130 | $1,616 | $15,514 |
| 2014 | $1,161 | $13,980 | $1,321 | $12,659 |
Source: Public Records
Map
Nearby Homes
- 748 N Downing St
- 734 N Downing St
- 724 Franklin St
- 1515 E 9th Ave Unit 210
- 1029 E 8th Ave Unit 103
- 1029 E 8th Ave Unit 206
- 1029 E 8th Ave Unit 901
- 1321 E 10th Ave Unit 4
- 707 Corona St
- 1006 E 9th Ave
- 1010 N Downing St Unit 5
- 575 N Marion St
- 1040 N Humboldt St
- 951 N Corona St Unit 5
- 1000 E 7th Ave
- 985 Corona St Unit 203
- 615 N Williams St
- 1008 N Corona St Unit 604
- 1090 N Lafayette St Unit 503
- 680 Emerson St
- 1422 E 8th Ave Unit 11
- 1422 E 8th Ave
- 1422 E 8th Ave
- 1422 E 8th Ave
- 1422 E 8th Ave Unit 9
- 1422 E 8th Ave Unit 8
- 1422 E 8th Ave
- 1414 E 8th Ave Unit 6
- 1414 E 8th Ave Unit 5
- 1414 E 8th Ave Unit 4
- 1414 E 8th Ave
- 1414 E 8th Ave Unit 2
- 1414 E 8th Ave
- 1422 E 8th Ave Unit 12
- 774 Lafayette St
- 774 N Lafayette St
- 1426 E 8th Ave
- 800 Lafayette St
- 770 N Lafayette St
- 770 Lafayette St