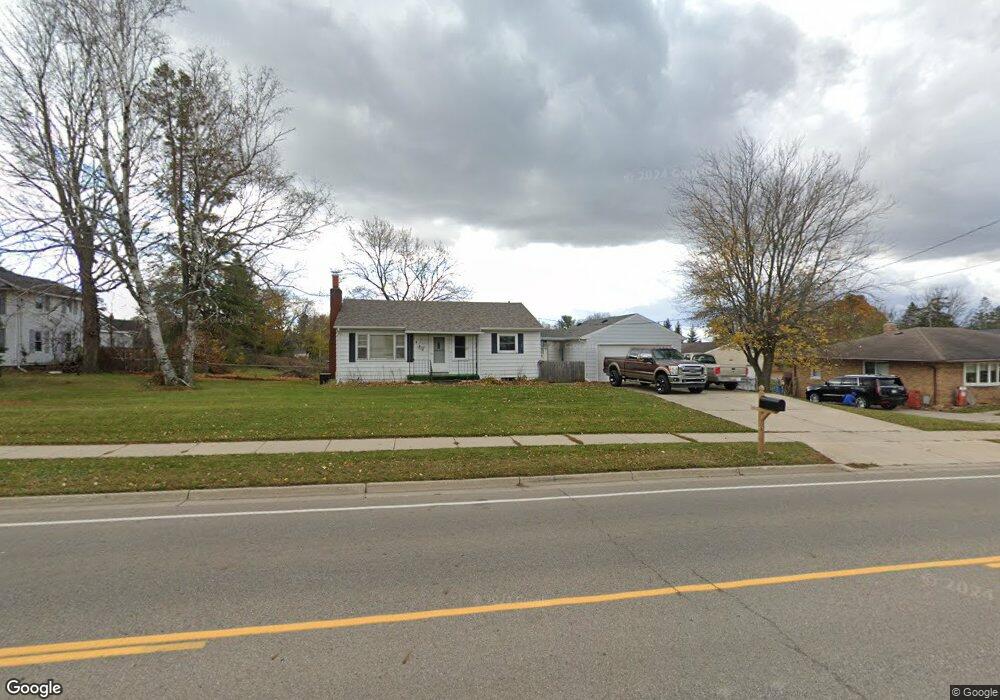
1422 E Miller Rd Lansing, MI 48911
Southern Lansing NeighborhoodEstimated Value: $149,090 - $202,000
Studio
--
Bath
1,080
Sq Ft
$168/Sq Ft
Est. Value
About This Home
This home is located at 1422 E Miller Rd, Lansing, MI 48911 and is currently estimated at $181,023, approximately $167 per square foot. 1422 E Miller Rd is a home located in Ingham County with nearby schools including Forest View School, Attwood School, and Everett High School.
Ownership History
Date
Name
Owned For
Owner Type
Purchase Details
Closed on
Sep 23, 2024
Sold by
Wallace Cynthia L and Carter Janet S
Bought by
Wallace Cynthia L
Current Estimated Value
Purchase Details
Closed on
Oct 4, 2023
Sold by
Johns Benjamin Ross and Johns Margo K
Bought by
Johns Hayley and Johns Katelyn
Purchase Details
Closed on
Oct 19, 2022
Sold by
Buck And Mary Llc
Bought by
Wallace Cynthia L
Purchase Details
Closed on
Nov 1, 2021
Sold by
Frison Christopher A and Frison Sheila
Bought by
Buck And Mary Llc
Purchase Details
Closed on
Jul 1, 2011
Sold by
Parker Kathleen M
Bought by
Wiseman Shelia and Frison Christopher A
Purchase Details
Closed on
Sep 21, 2009
Sold by
Wallace Cynthia L
Bought by
Buck & Mary Llc
Purchase Details
Closed on
Mar 21, 1996
Sold by
Bedell Shanna
Bought by
Wallace Cynthia
Purchase Details
Closed on
May 1, 1992
Create a Home Valuation Report for This Property
The Home Valuation Report is an in-depth analysis detailing your home's value as well as a comparison with similar homes in the area
Home Values in the Area
Average Home Value in this Area
Purchase History
| Date | Buyer | Sale Price | Title Company |
|---|---|---|---|
| Wallace Cynthia L | -- | None Listed On Document | |
| Johns Hayley | -- | -- | |
| Wallace Cynthia L | -- | -- | |
| Buck And Mary Llc | -- | None Available | |
| Wiseman Shelia | -- | None Available | |
| Buck & Mary Llc | -- | None Available | |
| Wallace Cynthia | $73,500 | -- | |
| -- | $66,000 | -- |
Source: Public Records
Tax History
| Year | Tax Paid | Tax Assessment Tax Assessment Total Assessment is a certain percentage of the fair market value that is determined by local assessors to be the total taxable value of land and additions on the property. | Land | Improvement |
|---|---|---|---|---|
| 2025 | $2,610 | $74,100 | $10,200 | $63,900 |
| 2024 | $18 | $58,600 | $10,200 | $48,400 |
| 2023 | $4,681 | $53,500 | $10,200 | $43,300 |
| 2022 | $2,971 | $46,600 | $10,200 | $36,400 |
| 2021 | $2,769 | $40,900 | $7,400 | $33,500 |
| 2020 | $2,760 | $39,100 | $7,400 | $31,700 |
| 2019 | $4,924 | $34,100 | $7,400 | $26,700 |
| 2018 | $2,566 | $31,000 | $7,400 | $23,600 |
| 2017 | $2,488 | $31,000 | $7,400 | $23,600 |
| 2016 | $2,073 | $30,500 | $7,400 | $23,100 |
| 2015 | $2,073 | $28,900 | $14,722 | $14,178 |
| 2014 | $2,073 | $27,500 | $24,536 | $2,964 |
Source: Public Records
Map
Nearby Homes
- 6264 Beechfield Dr Unit 97
- 6321 Beechfield Dr Unit 37
- 6300 Beechfield Dr Unit 87
- 6331 Beechfield Dr Unit 42
- 6137 Scotmar Dr Unit 19
- 6317 Beechfield Dr Unit 49
- 6341 Beechfield Dr Unit 53
- 6129 Scotmar Dr Unit 15
- 6422 Lerner Way
- 1521 Born Trail Unit lot 232
- 6704 Mill Stream Ln
- 1265 Roth Dr
- 6741 Helman Blvd Unit lot 203
- 4485 Helmsway Dr
- 2702 Yachtsman Dr
- 6815 Aurelius Rd
- 2670 Brigantine Dr
- 7061 W Bickett Blvd
- 6246 Gardenia Ave
- 1109 Barr Ave
- 1414 E Ller
- 1414 E Miller Rd
- 1432 E Miller Rd
- 1432 E Ller
- 1408 E Ller
- 1408 E Miller Rd
- 6120 Norburn Way
- 6129 Beechfield Dr
- 6101 Norburn Way
- 6115 Norburn Way
- 6123 Norburn Way
- 6136 Norburn Way
- 6129 Norburn Way
- 6100 Marscot Dr
- 6112 Marscot Dr
- 6120 Marscot Dr
- 6124 Beechfield Dr Unit 137
- 6144 Norburn Way
- 6126 Beechfield Dr Unit 138
Your Personal Tour Guide
Ask me questions while you tour the home.