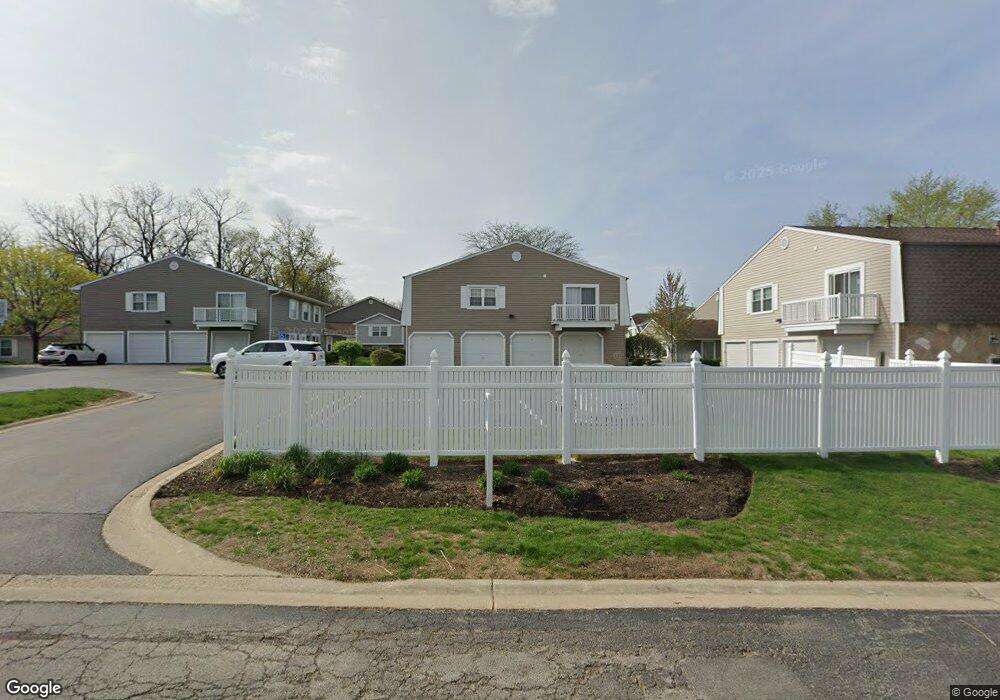
1422 Woodcutter Ln Unit A Wheaton, IL 60189
West Wheaton NeighborhoodEstimated Value: $201,000 - $252,000
Studio
--
Bath
777
Sq Ft
$297/Sq Ft
Est. Value
About This Home
This home is located at 1422 Woodcutter Ln Unit A, Wheaton, IL 60189 and is currently estimated at $230,583, approximately $296 per square foot. 1422 Woodcutter Ln Unit A is a home located in DuPage County with nearby schools including Madison Elementary School, Edison Middle School, and Wheaton Warrenville South High School.
Ownership History
Date
Name
Owned For
Owner Type
Purchase Details
Closed on
Sep 26, 2000
Sold by
Gruden James J
Bought by
Fischer Jonathan T and Fischer Janice L
Current Estimated Value
Home Financials for this Owner
Home Financials are based on the most recent Mortgage that was taken out on this home.
Original Mortgage
$93,500
Outstanding Balance
$34,902
Interest Rate
8.25%
Estimated Equity
$195,681
Purchase Details
Closed on
Feb 15, 1995
Sold by
Payette John B and Payette Lynne
Bought by
Gruden James J
Home Financials for this Owner
Home Financials are based on the most recent Mortgage that was taken out on this home.
Original Mortgage
$91,670
Interest Rate
9.26%
Mortgage Type
Assumption
Create a Home Valuation Report for This Property
The Home Valuation Report is an in-depth analysis detailing your home's value as well as a comparison with similar homes in the area
Home Values in the Area
Average Home Value in this Area
Purchase History
| Date | Buyer | Sale Price | Title Company |
|---|---|---|---|
| Fischer Jonathan T | $110,500 | -- | |
| Gruden James J | $89,000 | -- |
Source: Public Records
Mortgage History
| Date | Status | Borrower | Loan Amount |
|---|---|---|---|
| Open | Fischer Jonathan T | $93,500 | |
| Previous Owner | Gruden James J | $91,670 |
Source: Public Records
Tax History
| Year | Tax Paid | Tax Assessment Tax Assessment Total Assessment is a certain percentage of the fair market value that is determined by local assessors to be the total taxable value of land and additions on the property. | Land | Improvement |
|---|---|---|---|---|
| 2024 | $3,117 | $64,358 | $5,323 | $59,035 |
| 2023 | $3,463 | $59,240 | $4,900 | $54,340 |
| 2022 | $3,072 | $50,360 | $4,630 | $45,730 |
| 2021 | $3,055 | $49,160 | $4,520 | $44,640 |
| 2020 | $3,042 | $48,700 | $4,480 | $44,220 |
| 2019 | $2,965 | $47,410 | $4,360 | $43,050 |
| 2018 | $2,508 | $40,620 | $4,110 | $36,510 |
| 2017 | $2,287 | $36,820 | $3,740 | $33,080 |
| 2016 | $2,243 | $35,350 | $3,590 | $31,760 |
| 2015 | $2,209 | $33,720 | $3,420 | $30,300 |
| 2014 | $2,868 | $41,370 | $4,200 | $37,170 |
| 2013 | $2,795 | $41,490 | $4,210 | $37,280 |
Source: Public Records
Map
Nearby Homes
- 1478 Timber Trail Unit 15C
- 1474 Timber Trail Unit D
- 615 Polo Dr
- 705 S Gables Blvd
- 315 S Morgan Ave
- 833 Parkside Dr
- 1021 Greenwood Dr
- 107 N Pierce Ave
- Lot 1 Foothill Dr
- 1028 Lodalia Ct
- 536 W Evergreen St
- 2043 Spring Green Dr
- 1219 Golf Ln
- 1601 W Wiesbrook Rd
- 522 S West St
- 921 James Ct
- 1605 Burning Trail
- 520 S Wheaton Ave
- 1442 Stonebridge Cir Unit I8
- 1462 Stonebridge Cir Unit F10
- 1422 Woodcutter Ln Unit B
- 1422 Woodcutter Ln Unit 22C
- 1414 Woodcutter Ln Unit A
- 1414 Woodcutter Ln Unit D
- 1414 Woodcutter Ln Unit C
- 1438 Woodcutter Ln Unit C
- 1438 Woodcutter Ln Unit B
- 1438 Woodcutter Ln Unit 23C
- 1438 Woodcutter Ln Unit 20D
- 1438 Woodcutter Ln Unit D
- 1504 Timber Trail Unit D
- 1504 Timber Trail Unit B
- 1504 Timber Trail Unit 25C
- 1504 Timber Trail Unit A
- 1504 Timber Trail Unit C
- 1480 Timber Trail Unit 15A
- 1476 Timber Trail Unit 15D
- 1468 Timber Trail Unit 16B
- 1400 Woodcutter Ln Unit C
- 1400 Woodcutter Ln Unit D
Your Personal Tour Guide
Ask me questions while you tour the home.