Estimated Value: $298,000 - $370,000
3
Beds
3
Baths
1,666
Sq Ft
$198/Sq Ft
Est. Value
About This Home
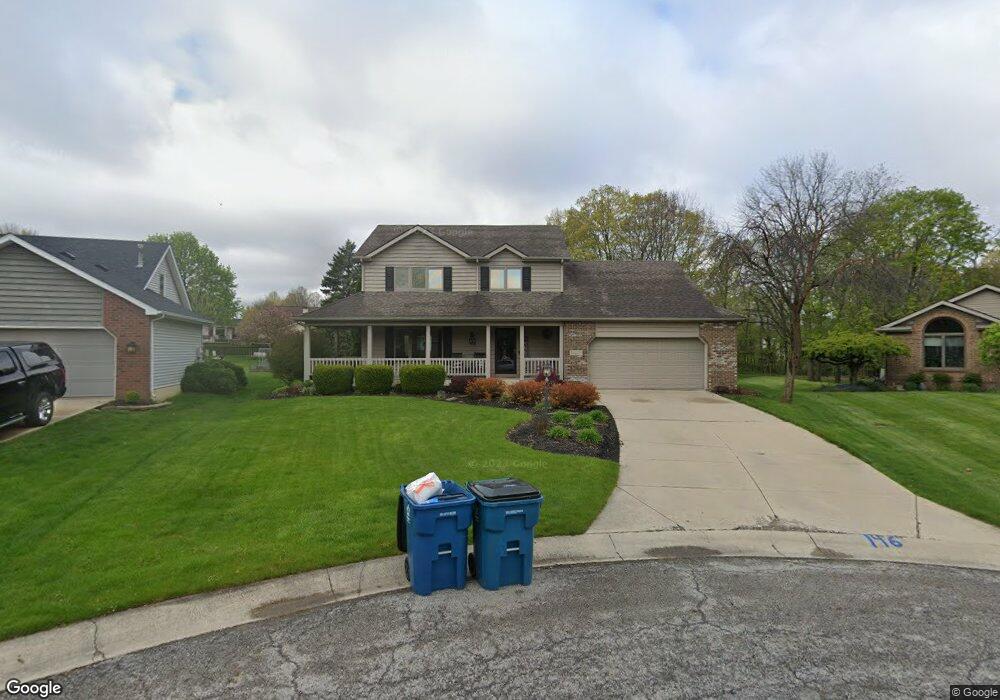
This home is located at 14225 Flint Ct, Leo, IN 46765 and is currently estimated at $330,562, approximately $198 per square foot. 14225 Flint Ct is a home located in Allen County with nearby schools including Leo Elementary School, Cedarville Elementary School, and Leo Junior/Senior High School.
Ownership History
Date
Name
Owned For
Owner Type
Purchase Details
Closed on
Jul 19, 2016
Bought by
Sheron Ronald and Sheron Rhonda
Current Estimated Value
Home Financials for this Owner
Home Financials are based on the most recent Mortgage that was taken out on this home.
Original Mortgage
$131,988
Outstanding Balance
$103,953
Interest Rate
3.42%
Estimated Equity
$226,609
Purchase Details
Closed on
Mar 3, 2003
Sold by
Carlson David R and Carlson Audra A
Bought by
Sheron Ronald E and Sheron Rhonda L
Home Financials for this Owner
Home Financials are based on the most recent Mortgage that was taken out on this home.
Original Mortgage
$154,432
Interest Rate
6%
Mortgage Type
FHA
Purchase Details
Closed on
May 25, 2001
Sold by
Penn James L and Penn Bobi J
Bought by
Carlson David R and Carlson Audra A
Home Financials for this Owner
Home Financials are based on the most recent Mortgage that was taken out on this home.
Original Mortgage
$102,000
Interest Rate
7.23%
Create a Home Valuation Report for This Property
The Home Valuation Report is an in-depth analysis detailing your home's value as well as a comparison with similar homes in the area
Home Values in the Area
Average Home Value in this Area
Purchase History
| Date | Buyer | Sale Price | Title Company |
|---|---|---|---|
| Sheron Ronald | -- | -- | |
| Sheron Ronald E | -- | -- | |
| Carlson David R | -- | Three Rivers Title Company I |
Source: Public Records
Mortgage History
| Date | Status | Borrower | Loan Amount |
|---|---|---|---|
| Open | Sheron Ronald | $131,988 | |
| Closed | Sheron Ronald | -- | |
| Previous Owner | Sheron Ronald E | $154,432 | |
| Previous Owner | Carlson David R | $102,000 |
Source: Public Records
Tax History
| Year | Tax Paid | Tax Assessment Tax Assessment Total Assessment is a certain percentage of the fair market value that is determined by local assessors to be the total taxable value of land and additions on the property. | Land | Improvement |
|---|---|---|---|---|
| 2025 | $2,615 | $292,000 | $42,200 | $249,800 |
| 2024 | $2,421 | $272,500 | $42,200 | $230,300 |
| 2022 | $2,179 | $248,400 | $42,200 | $206,200 |
| 2021 | $1,814 | $220,200 | $42,200 | $178,000 |
| 2020 | $1,630 | $195,000 | $42,200 | $152,800 |
| 2019 | $1,458 | $182,300 | $42,200 | $140,100 |
| 2018 | $1,568 | $186,000 | $42,200 | $143,800 |
| 2017 | $1,442 | $171,000 | $42,200 | $128,800 |
| 2016 | $1,385 | $166,200 | $42,200 | $124,000 |
| 2014 | $1,298 | $159,700 | $42,200 | $117,500 |
| 2013 | $1,278 | $156,000 | $42,200 | $113,800 |
Source: Public Records
Map
Nearby Homes
- 9708 Pioneer Trail
- 10222 Riverview Dr
- 15114 Lions Passage
- 14981 Leo Creek Blvd
- 10120 Donald Ave
- 10421 Main St
- 15026 Leo Creek Blvd
- 9522 Poplar Creek Place
- 15188 Leo Creek Blvd
- 8716 Multirose Ln
- 15293 Leo Creek Blvd
- 8693 Leonis Run
- 15395 Makarios Pass Unit 32
- 15535 Makarios Pass Unit 37
- 15430 Makarios Pass Unit 6
- 10878 Conrad Creek Ct Unit 17
- 15526 Makarios Pass Unit 3
- 15373 Makarios Pass Unit 31
- 10964 Conrad Creek Ct Unit 14
- 10932 Conrad Creek Ct
- 14233 Flint Ct
- 14217 Flint Ct
- 9621 Pioneer Trail
- 9609 Pioneer Trail
- 9633 Pioneer Trail
- 9703 Pioneer Trail
- 9711 Pioneer Trail
- 9719 Pioneer Trail
- 14209 Flint Ct
- 14232 Flint Ct
- 14216 Flint Ct
- 14224 Flint Ct
- 9815 Pioneer Trail
- 14230 Settlers Trail
- 9612 Pioneer Trail
- 9624 Pioneer Trail
- 9636 Pioneer Trail
- 9704 Pioneer Trail
- 9712 Pioneer Trail
- 9716 Pioneer Trail
Your Personal Tour Guide
Ask me questions while you tour the home.