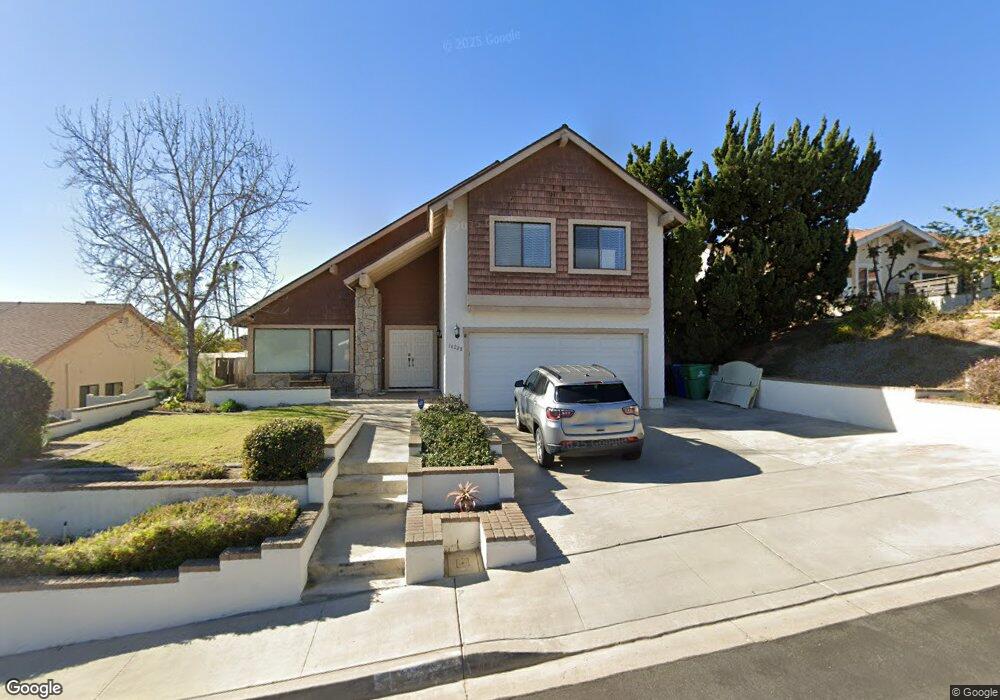
14228 Barrymore St San Diego, CA 92129
Rancho Peñasquitos NeighborhoodEstimated Value: $1,433,387 - $1,581,000
4
Beds
3
Baths
2,419
Sq Ft
$625/Sq Ft
Est. Value
About This Home
This home is located at 14228 Barrymore St, San Diego, CA 92129 and is currently estimated at $1,511,347, approximately $624 per square foot. 14228 Barrymore St is a home located in San Diego County with nearby schools including Adobe Bluffs Elementary School, Black Mountain Middle School, and Mt. Carmel High School.
Ownership History
Date
Name
Owned For
Owner Type
Purchase Details
Closed on
May 9, 2024
Sold by
Rearick William C and Rearick Kim
Bought by
Rearick Family Trust and Reavick
Current Estimated Value
Purchase Details
Closed on
Oct 24, 1997
Sold by
Nelson Buddy R and Nelson Valerie J
Bought by
Rearick William C and Rearick Kim
Home Financials for this Owner
Home Financials are based on the most recent Mortgage that was taken out on this home.
Original Mortgage
$222,300
Interest Rate
7.23%
Purchase Details
Closed on
Jun 7, 1991
Purchase Details
Closed on
Nov 1, 1984
Purchase Details
Closed on
Jun 15, 1984
Create a Home Valuation Report for This Property
The Home Valuation Report is an in-depth analysis detailing your home's value as well as a comparison with similar homes in the area
Home Values in the Area
Average Home Value in this Area
Purchase History
| Date | Buyer | Sale Price | Title Company |
|---|---|---|---|
| Rearick Family Trust | -- | None Listed On Document | |
| Rearick William C | $247,000 | Chicago Title Insurance Co | |
| -- | $252,500 | -- | |
| -- | $164,300 | -- | |
| -- | $164,000 | -- |
Source: Public Records
Mortgage History
| Date | Status | Borrower | Loan Amount |
|---|---|---|---|
| Previous Owner | Rearick William C | $222,300 |
Source: Public Records
Tax History Compared to Growth
Tax History
| Year | Tax Paid | Tax Assessment Tax Assessment Total Assessment is a certain percentage of the fair market value that is determined by local assessors to be the total taxable value of land and additions on the property. | Land | Improvement |
|---|---|---|---|---|
| 2025 | $4,412 | $394,371 | $167,813 | $226,558 |
| 2024 | $4,412 | $386,639 | $164,523 | $222,116 |
| 2023 | $4,317 | $379,059 | $161,298 | $217,761 |
| 2022 | $4,244 | $371,628 | $158,136 | $213,492 |
| 2021 | $4,188 | $364,342 | $155,036 | $209,306 |
| 2020 | $4,131 | $360,607 | $153,447 | $207,160 |
| 2019 | $4,024 | $353,538 | $150,439 | $203,099 |
| 2018 | $3,911 | $346,607 | $147,490 | $199,117 |
| 2017 | $3,806 | $339,812 | $144,599 | $195,213 |
| 2016 | $3,728 | $333,150 | $141,764 | $191,386 |
| 2015 | $3,673 | $328,147 | $139,635 | $188,512 |
| 2014 | $3,587 | $321,720 | $136,900 | $184,820 |
Source: Public Records
Map
Nearby Homes
- 8862 La Cartera St
- 9120 Meadowrun Place
- 12092 Gavin Way
- 14305 El Vestido St
- 13907 Bruyere Ct
- 14442 Calle Nublado
- 9360 Stargaze Ave
- 9151 Emden Rd
- 8730 Twin Trails Dr
- 13559 Chaco Ct
- 8183 Doug Hill
- 7795 Sendero Angelica
- 8114 Sendero de La Pradera
- 13445 Appalachian Way
- 13640 Via Cima Bella
- 13411 Appalachian Way
- 13146 Thunderhead St
- 9555 Via Pereza
- 13856 Paseo Cardiel
- 13879 Paseo Cardiel
- 14236 Barrymore St
- 14220 Barrymore St
- 8968 Stargaze Ave
- 14212 Barrymore St
- 8958 Stargaze Ave
- 14244 Barrymore St
- 8988 Stargaze Ave
- 8978 Stargaze Ave
- 8948 Stargaze Ave
- 14233 Barrymore St
- 14225 Barrymore St
- 9002 Stargaze Ave
- 14241 Barrymore St
- 14252 Barrymore St
- 8938 Stargaze Ave
- 14249 Barrymore St
- 8928 Stargaze Ave
- 14180 Barrymore St
- 14260 Barrymore St
- 9025 Meadowrun Ct