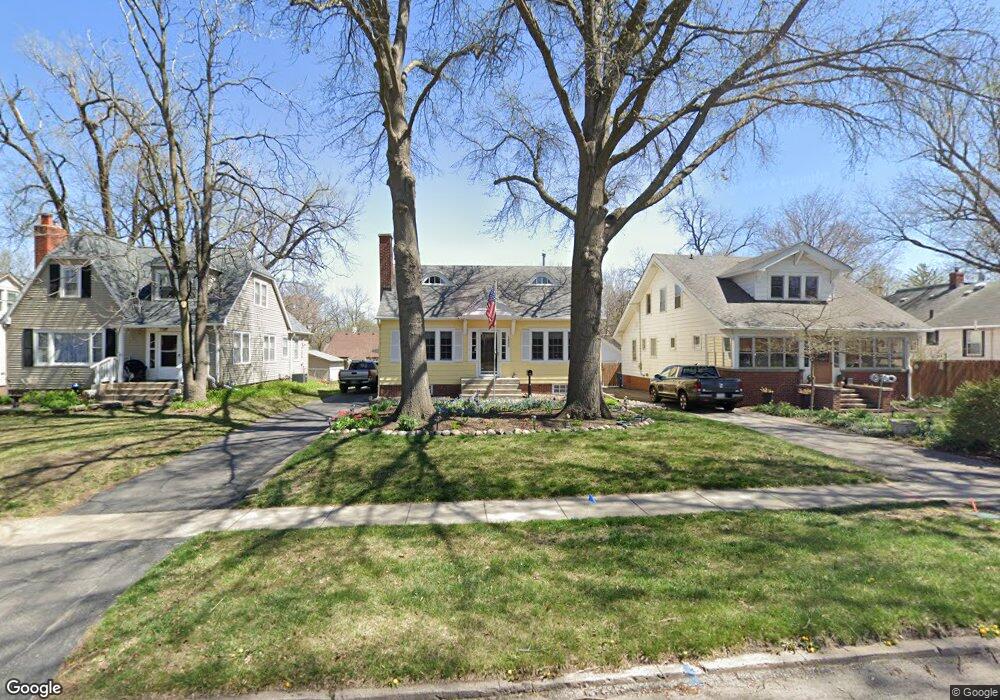
1423 44th St Des Moines, IA 50311
Beaverdale NeighborhoodEstimated Value: $258,000 - $272,000
3
Beds
1
Bath
1,509
Sq Ft
$177/Sq Ft
Est. Value
About This Home
This home is located at 1423 44th St, Des Moines, IA 50311 and is currently estimated at $266,828, approximately $176 per square foot. 1423 44th St is a home located in Polk County with nearby schools including Perkins Elementary School, Merrill Middle School, and Roosevelt High School.
Ownership History
Date
Name
Owned For
Owner Type
Purchase Details
Closed on
Aug 15, 1997
Sold by
Johnston Velma Eyvonne
Bought by
Gregory Mark Douglas and Gregory Amanda Jane
Current Estimated Value
Home Financials for this Owner
Home Financials are based on the most recent Mortgage that was taken out on this home.
Original Mortgage
$68,400
Outstanding Balance
$10,406
Interest Rate
7.71%
Estimated Equity
$256,422
Create a Home Valuation Report for This Property
The Home Valuation Report is an in-depth analysis detailing your home's value as well as a comparison with similar homes in the area
Home Values in the Area
Average Home Value in this Area
Purchase History
| Date | Buyer | Sale Price | Title Company |
|---|---|---|---|
| Gregory Mark Douglas | $85,000 | -- |
Source: Public Records
Mortgage History
| Date | Status | Borrower | Loan Amount |
|---|---|---|---|
| Open | Gregory Mark Douglas | $68,400 |
Source: Public Records
Tax History Compared to Growth
Tax History
| Year | Tax Paid | Tax Assessment Tax Assessment Total Assessment is a certain percentage of the fair market value that is determined by local assessors to be the total taxable value of land and additions on the property. | Land | Improvement |
|---|---|---|---|---|
| 2025 | $4,244 | $262,000 | $52,700 | $209,300 |
| 2024 | $4,244 | $233,200 | $46,700 | $186,500 |
| 2023 | $4,388 | $233,200 | $46,700 | $186,500 |
| 2022 | $4,354 | $195,100 | $41,200 | $153,900 |
| 2021 | $4,212 | $195,100 | $41,200 | $153,900 |
| 2020 | $4,370 | $177,400 | $37,600 | $139,800 |
| 2019 | $3,994 | $177,400 | $37,600 | $139,800 |
| 2018 | $3,948 | $157,100 | $32,900 | $124,200 |
| 2017 | $3,596 | $157,100 | $32,900 | $124,200 |
| 2016 | $3,500 | $141,500 | $29,500 | $112,000 |
| 2015 | $3,500 | $141,500 | $29,500 | $112,000 |
| 2014 | $3,070 | $128,800 | $26,700 | $102,100 |
Source: Public Records
Map
Nearby Homes