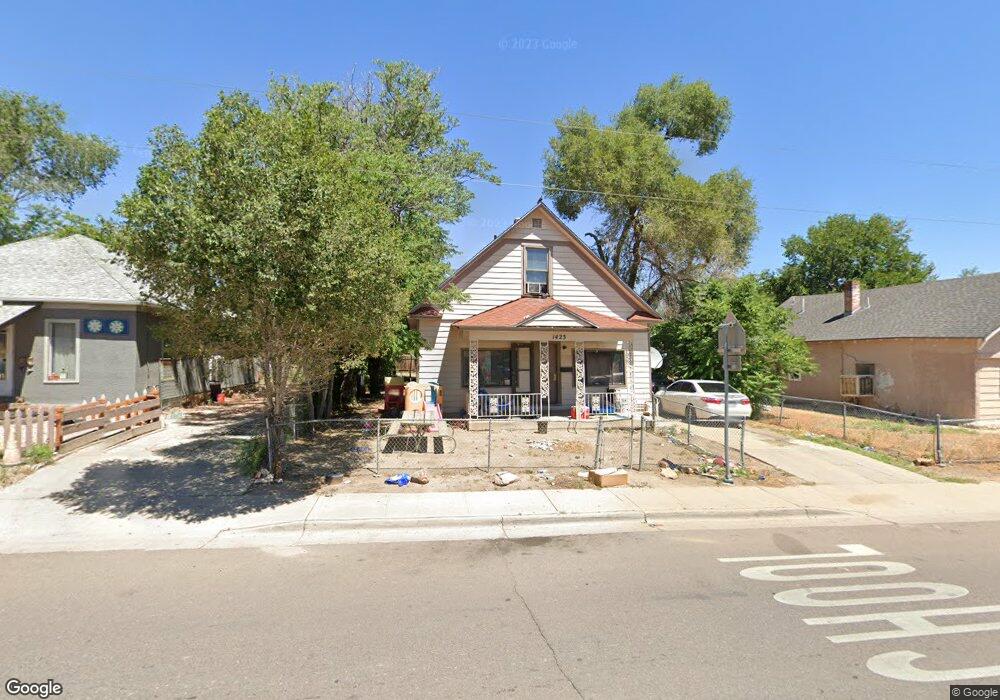
1423 E 4th St Pueblo, CO 81001
East Side NeighborhoodEstimated Value: $133,312 - $188,000
2
Beds
1
Bath
1,260
Sq Ft
$119/Sq Ft
Est. Value
About This Home
This home is located at 1423 E 4th St, Pueblo, CO 81001 and is currently estimated at $150,328, approximately $119 per square foot. 1423 E 4th St is a home located in Pueblo County with nearby schools including Park View Elementary School, Risley International Academy of Innovation, and East High School.
Ownership History
Date
Name
Owned For
Owner Type
Purchase Details
Closed on
Feb 28, 2024
Sold by
Naglich Nathan
Bought by
Naglich Kayla
Current Estimated Value
Purchase Details
Closed on
Nov 27, 1991
Sold by
Cs S + L
Bought by
Naglich Mark + Angela R
Purchase Details
Closed on
Dec 21, 1990
Sold by
Frederick Kenneth L + Rita Ja
Bought by
Colorado Springs Savings + Loa
Purchase Details
Closed on
Oct 29, 1982
Sold by
Haney Marvin D
Bought by
Frederick Kenneth L + Rita Ja
Purchase Details
Closed on
Aug 18, 1982
Sold by
Assoc Fin Services Co Of Colo
Bought by
Haney Marvin D
Purchase Details
Closed on
Dec 28, 1981
Sold by
Martinez Palemon + Pearl
Bought by
Assoc Fin Services Co Of Colo
Purchase Details
Closed on
Apr 12, 1977
Sold by
Cox Albert B + Fern D
Bought by
Martinez Palemon + Pearl
Purchase Details
Closed on
Jan 20, 1970
Bought by
Cox Albert B + Fern D
Create a Home Valuation Report for This Property
The Home Valuation Report is an in-depth analysis detailing your home's value as well as a comparison with similar homes in the area
Home Values in the Area
Average Home Value in this Area
Purchase History
| Date | Buyer | Sale Price | Title Company |
|---|---|---|---|
| Naglich Kayla | -- | None Listed On Document | |
| Naglich Mark + Angela R | $8,500 | -- | |
| Colorado Springs Savings + Loa | -- | -- | |
| Frederick Kenneth L + Rita Ja | $31,000 | -- | |
| Haney Marvin D | $15,000 | -- | |
| Assoc Fin Services Co Of Colo | -- | -- | |
| Martinez Palemon + Pearl | $11,000 | -- | |
| Cox Albert B + Fern D | $5,500 | -- |
Source: Public Records
Tax History Compared to Growth
Tax History
| Year | Tax Paid | Tax Assessment Tax Assessment Total Assessment is a certain percentage of the fair market value that is determined by local assessors to be the total taxable value of land and additions on the property. | Land | Improvement |
|---|---|---|---|---|
| 2024 | $423 | $4,260 | -- | -- |
| 2023 | $428 | $7,950 | $1,010 | $6,940 |
| 2022 | $486 | $4,900 | $400 | $4,500 |
| 2021 | $502 | $5,040 | $410 | $4,630 |
| 2020 | $398 | $5,040 | $410 | $4,630 |
| 2019 | $397 | $3,933 | $286 | $3,647 |
| 2018 | $263 | $2,906 | $288 | $2,618 |
| 2017 | $266 | $2,906 | $288 | $2,618 |
| 2016 | $251 | $2,757 | $318 | $2,439 |
| 2015 | $125 | $2,757 | $318 | $2,439 |
| 2014 | $136 | $2,998 | $318 | $2,680 |
Source: Public Records
Map
Nearby Homes