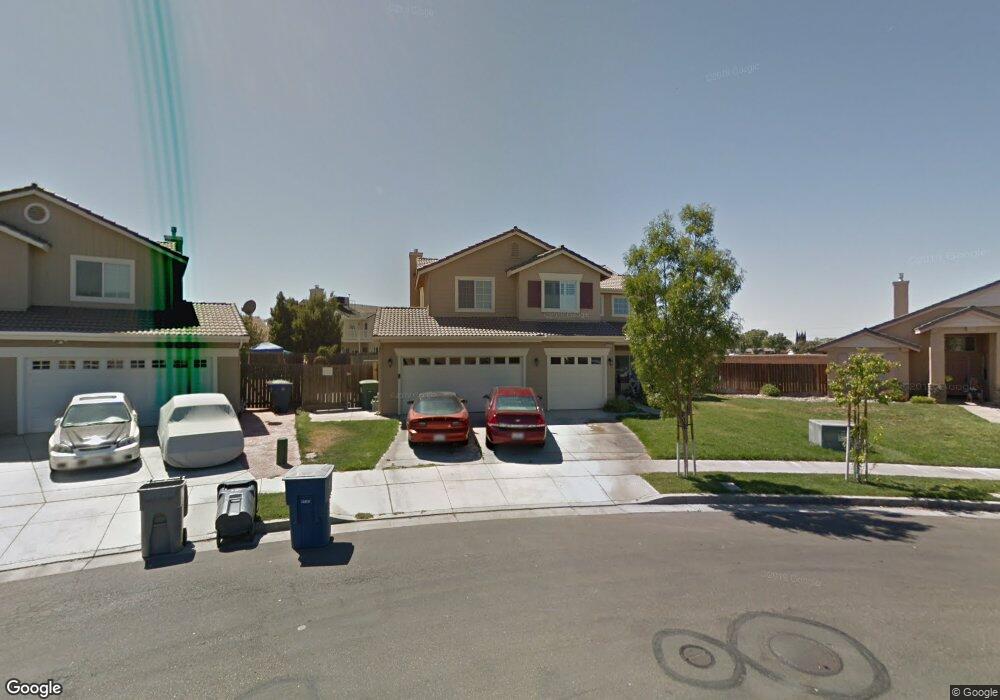
1423 Nottingham Cir Los Banos, CA 93635
Estimated Value: $531,000 - $591,181
5
Beds
3
Baths
2,462
Sq Ft
$225/Sq Ft
Est. Value
About This Home
This home is located at 1423 Nottingham Cir, Los Banos, CA 93635 and is currently estimated at $553,795, approximately $224 per square foot. 1423 Nottingham Cir is a home located in Merced County with nearby schools including Grasslands Elementary School, Los Banos Junior High School, and Pacheco High School.
Ownership History
Date
Name
Owned For
Owner Type
Purchase Details
Closed on
Mar 26, 2009
Sold by
Summer Stone Llc
Bought by
Magana Jose Luis and Magana Mary Jane
Current Estimated Value
Home Financials for this Owner
Home Financials are based on the most recent Mortgage that was taken out on this home.
Original Mortgage
$207,178
Outstanding Balance
$132,440
Interest Rate
5.15%
Mortgage Type
FHA
Estimated Equity
$421,355
Purchase Details
Closed on
Oct 9, 2008
Sold by
Us Bank National Association
Bought by
Summer Stone Llc
Purchase Details
Closed on
Aug 5, 2008
Sold by
Costa Joseph and Costa Kameal
Bought by
Us Bank Na
Purchase Details
Closed on
Jun 15, 2004
Sold by
N T Hill Inc
Bought by
Costa Joseph and Costa Kameal
Home Financials for this Owner
Home Financials are based on the most recent Mortgage that was taken out on this home.
Original Mortgage
$311,100
Interest Rate
5.12%
Mortgage Type
Purchase Money Mortgage
Create a Home Valuation Report for This Property
The Home Valuation Report is an in-depth analysis detailing your home's value as well as a comparison with similar homes in the area
Home Values in the Area
Average Home Value in this Area
Purchase History
| Date | Buyer | Sale Price | Title Company |
|---|---|---|---|
| Magana Jose Luis | $211,000 | Fidelity Natl Title Co Of Ca | |
| Summer Stone Llc | $185,000 | Orange Coast Title | |
| Us Bank Na | $159,250 | Accommodation | |
| Costa Joseph | $380,000 | Fidelity Title Company |
Source: Public Records
Mortgage History
| Date | Status | Borrower | Loan Amount |
|---|---|---|---|
| Open | Magana Jose Luis | $207,178 | |
| Previous Owner | Costa Joseph | $311,100 | |
| Closed | Costa Joseph | $77,800 |
Source: Public Records
Tax History Compared to Growth
Tax History
| Year | Tax Paid | Tax Assessment Tax Assessment Total Assessment is a certain percentage of the fair market value that is determined by local assessors to be the total taxable value of land and additions on the property. | Land | Improvement |
|---|---|---|---|---|
| 2025 | $3,941 | $297,319 | $32,184 | $265,135 |
| 2024 | $3,941 | $281,686 | $31,553 | $250,133 |
| 2023 | $3,723 | $276,164 | $30,935 | $245,229 |
| 2022 | $3,628 | $270,750 | $30,329 | $240,421 |
| 2021 | $3,634 | $265,442 | $29,735 | $235,707 |
| 2020 | $3,432 | $248,442 | $29,431 | $219,011 |
| 2019 | $3,368 | $243,571 | $28,854 | $214,717 |
| 2018 | $3,275 | $238,796 | $28,289 | $210,507 |
| 2017 | $3,233 | $234,115 | $27,735 | $206,380 |
| 2016 | $3,253 | $229,526 | $27,192 | $202,334 |
| 2015 | $3,190 | $226,079 | $26,784 | $199,295 |
| 2014 | $3,111 | $221,652 | $26,260 | $195,392 |
Source: Public Records
Map
Nearby Homes
- 1447 Nottingham Cir
- 343 San Bernardino St
- 418 Rockport Dr
- 1236 Santa Cruz Way
- 1416 San Rafael St
- 256 San Pelmo Ct
- 1453 Willmott Rd
- 436 N Mercey Springs Rd Unit 93
- 436 N Mercey Springs Rd Unit 154
- 436 N Mercey Springs Rd Unit 69
- 436 N Mercey Springs Rd Unit 16
- 17490 Mercey Springs Rd
- 405 N Santa Ana St
- 1351 E B St
- The Stella Plan at Southpointe
- The Argent Plan at Southpointe
- The Fasano Plan at Southpointe
- The Monterey Plan at Southpointe
- The Caledonia Plan at Southpointe
- The Santa Cruz Plan at Southpointe
- 1421 Nottingham Cir
- 1425 Nottingham Cir
- 1400 Mission Dr
- 1402 Mission Dr
- 1419 Nottingham Cir
- 1427 Nottingham Cir
- 1404 Mission Dr
- 1418 Nottingham Cir
- 1406 Mission Dr
- 1417 Nottingham Cir
- 1429 Nottingham Cir
- 1403 Mission Dr Unit 10
- 1408 Mission Dr
- 1416 Nottingham Cir
- 1415 Nottingham Cir
- 1428 Nottingham Cir
- 1407 Mission Dr Unit 8
- 1431 Nottingham Cir
- 1405 Mission Dr Unit 9
- 1414 Nottingham Cir