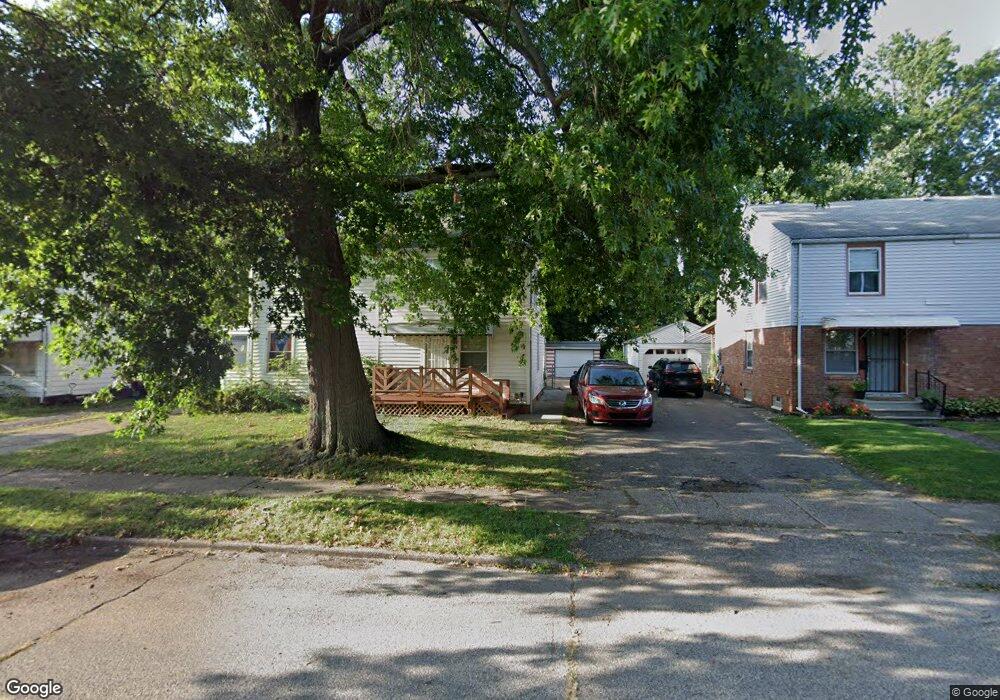
14230 Rainbow Ave Cleveland, OH 44111
Jefferson NeighborhoodEstimated Value: $87,692 - $114,000
2
Beds
2
Baths
832
Sq Ft
$119/Sq Ft
Est. Value
About This Home
This home is located at 14230 Rainbow Ave, Cleveland, OH 44111 and is currently estimated at $98,673, approximately $118 per square foot. 14230 Rainbow Ave is a home located in Cuyahoga County with nearby schools including Artemus Ward School, Almira Academy, and Anton Grdina School.
Ownership History
Date
Name
Owned For
Owner Type
Purchase Details
Closed on
Jan 24, 2011
Sold by
Nicula Lou Ann and Haldeman Lou Ann
Bought by
Nicula Narcis
Current Estimated Value
Home Financials for this Owner
Home Financials are based on the most recent Mortgage that was taken out on this home.
Original Mortgage
$29,600
Outstanding Balance
$20,219
Interest Rate
4.82%
Mortgage Type
New Conventional
Estimated Equity
$78,454
Purchase Details
Closed on
Mar 26, 2009
Sold by
Finlin Stephanie A
Bought by
Nicula Narcis and Nicula Lou Ann
Home Financials for this Owner
Home Financials are based on the most recent Mortgage that was taken out on this home.
Original Mortgage
$34,000
Interest Rate
5.22%
Mortgage Type
Future Advance Clause Open End Mortgage
Purchase Details
Closed on
Sep 29, 1992
Sold by
Finlin James K and Finlin Stephanie A
Bought by
Finlin Stephanie A
Purchase Details
Closed on
Jan 1, 1975
Bought by
Finlin James K and Finlin Stephanie A
Create a Home Valuation Report for This Property
The Home Valuation Report is an in-depth analysis detailing your home's value as well as a comparison with similar homes in the area
Home Values in the Area
Average Home Value in this Area
Purchase History
| Date | Buyer | Sale Price | Title Company |
|---|---|---|---|
| Nicula Narcis | -- | Mortgage Information Service | |
| Nicula Narcis | $40,500 | Cleveland Home Title Ltd | |
| Finlin Stephanie A | -- | -- | |
| Finlin James K | -- | -- |
Source: Public Records
Mortgage History
| Date | Status | Borrower | Loan Amount |
|---|---|---|---|
| Open | Nicula Narcis | $29,600 | |
| Closed | Nicula Narcis | $34,000 |
Source: Public Records
Tax History Compared to Growth
Tax History
| Year | Tax Paid | Tax Assessment Tax Assessment Total Assessment is a certain percentage of the fair market value that is determined by local assessors to be the total taxable value of land and additions on the property. | Land | Improvement |
|---|---|---|---|---|
| 2024 | $1,367 | $20,860 | $4,620 | $16,240 |
| 2023 | $1,060 | $13,970 | $3,430 | $10,540 |
| 2022 | $1,054 | $13,965 | $3,430 | $10,535 |
| 2021 | $1,043 | $13,970 | $3,430 | $10,540 |
| 2020 | $934 | $10,820 | $2,660 | $8,160 |
| 2019 | $864 | $30,900 | $7,600 | $23,300 |
| 2018 | $431 | $10,820 | $2,660 | $8,160 |
| 2017 | $1,178 | $14,280 | $2,940 | $11,340 |
| 2016 | $1,168 | $14,280 | $2,940 | $11,340 |
| 2015 | $1,898 | $14,280 | $2,940 | $11,340 |
| 2014 | $1,898 | $15,020 | $3,080 | $11,940 |
Source: Public Records
Map
Nearby Homes
- 14315 Rainbow Ave
- 14303 Tuckahoe Ave
- 3475 W 145th St
- 14608 Triskett Rd
- 14625 Grapeland Ave
- 14328 Adrian Ave
- 13931 Lorain Ave
- 32743 Warren Rd Unit 19
- 32742 Warren Rd Unit 18
- 3615 W 147th St
- 14114 Berwyn Ave
- 14426 Alger Rd
- 3395 W 136th St
- 3445 W 152nd St
- 3452 W 135th St
- 3642 W 139th St
- 3431 W 135th St
- 3549 Warren Rd
- 3201 W 139th St
- 3334 W 155th St
- 14232 Rainbow Ave
- 14226 Rainbow Ave
- 14224 Rainbow Ave
- 14300 Rainbow Ave
- 14220 Rainbow Ave
- 14302 Rainbow Ave
- 14229 Gramatan Ave
- 14227 Gramatan Ave
- 14306 Rainbow Ave
- 14218 Rainbow Ave
- 14233 Gramatan Ave
- 14223 Gramatan Ave
- 14235 Gramatan Ave
- 14221 Gramatan Ave
- 14214 Rainbow Ave
- 14308 Rainbow Ave
- 14303 Gramatan Ave
- 14231 Rainbow Ave
- 14233 Rainbow Ave
- 14227 Rainbow Ave