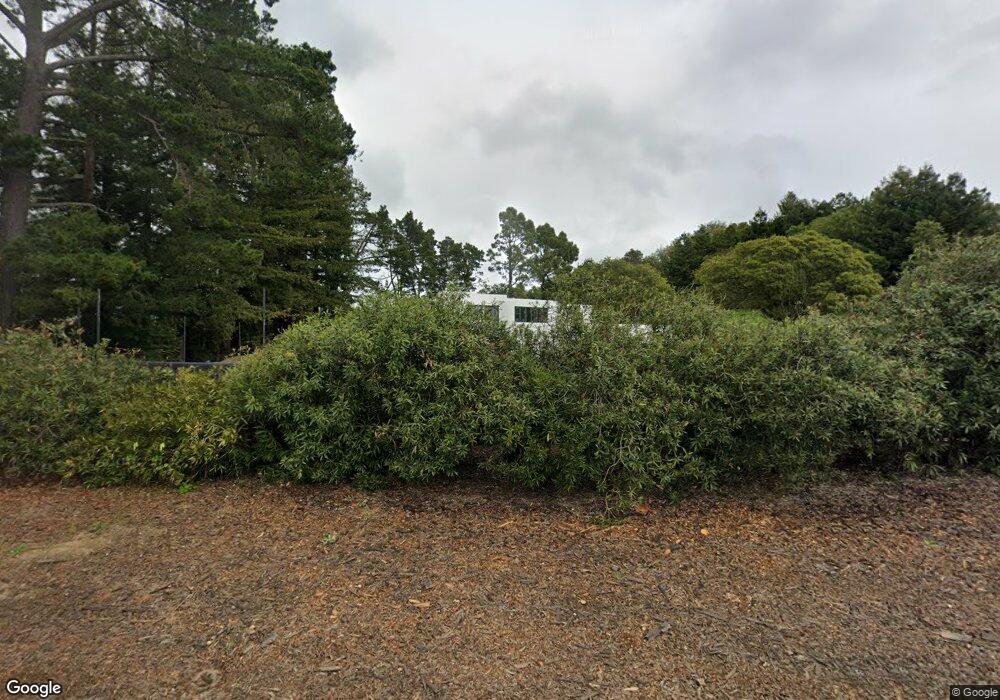
14230 Skyline Blvd Oakland, CA 94619
Estimated Value: $1,847,000 - $2,076,688
4
Beds
5
Baths
3,735
Sq Ft
$523/Sq Ft
Est. Value
About This Home
This home is located at 14230 Skyline Blvd, Oakland, CA 94619 and is currently estimated at $1,952,672, approximately $522 per square foot. 14230 Skyline Blvd is a home located in Alameda County with nearby schools including Carl B. Munck Elementary School, Montera Middle School, and Skyline High School.
Ownership History
Date
Name
Owned For
Owner Type
Purchase Details
Closed on
Nov 17, 2017
Sold by
Davenport Robert R
Bought by
Skyline Blvd Llc
Current Estimated Value
Home Financials for this Owner
Home Financials are based on the most recent Mortgage that was taken out on this home.
Original Mortgage
$828,750
Outstanding Balance
$694,453
Interest Rate
3.85%
Mortgage Type
New Conventional
Estimated Equity
$1,258,219
Purchase Details
Closed on
Dec 2, 1999
Sold by
Davenport Michele Y
Bought by
Davenport Robert R
Purchase Details
Closed on
May 15, 1999
Sold by
Steffen Donald K and Steffen Beverly J
Bought by
Davenport Robert R
Purchase Details
Closed on
Mar 14, 1995
Sold by
Steffen Donald K
Bought by
Steffen Donald K and Steffen Beverly J
Home Financials for this Owner
Home Financials are based on the most recent Mortgage that was taken out on this home.
Original Mortgage
$635,000
Interest Rate
8.37%
Create a Home Valuation Report for This Property
The Home Valuation Report is an in-depth analysis detailing your home's value as well as a comparison with similar homes in the area
Home Values in the Area
Average Home Value in this Area
Purchase History
| Date | Buyer | Sale Price | Title Company |
|---|---|---|---|
| Skyline Blvd Llc | $1,657,500 | Old Republic Title Company | |
| Davenport Robert R | -- | Placer Title Company | |
| Davenport Robert R | $975,000 | Placer Title Company | |
| Steffen Donald K | -- | Fidelity National Title Ins |
Source: Public Records
Mortgage History
| Date | Status | Borrower | Loan Amount |
|---|---|---|---|
| Open | Skyline Blvd Llc | $828,750 | |
| Previous Owner | Steffen Donald K | $635,000 |
Source: Public Records
Tax History Compared to Growth
Tax History
| Year | Tax Paid | Tax Assessment Tax Assessment Total Assessment is a certain percentage of the fair market value that is determined by local assessors to be the total taxable value of land and additions on the property. | Land | Improvement |
|---|---|---|---|---|
| 2025 | $25,520 | $1,885,920 | $568,905 | $1,317,015 |
| 2024 | $25,520 | $1,848,941 | $557,750 | $1,291,191 |
| 2023 | $27,010 | $1,812,691 | $546,815 | $1,265,876 |
| 2022 | $26,452 | $1,777,154 | $536,095 | $1,241,059 |
| 2021 | $25,656 | $1,742,314 | $525,585 | $1,216,729 |
| 2020 | $25,374 | $1,724,463 | $520,200 | $1,204,263 |
| 2019 | $24,651 | $1,690,650 | $510,000 | $1,180,650 |
| 2018 | $24,120 | $1,657,500 | $500,000 | $1,157,500 |
| 2017 | $19,129 | $1,316,980 | $395,094 | $921,886 |
| 2016 | $18,938 | $1,291,162 | $387,348 | $903,814 |
| 2015 | $18,555 | $1,271,770 | $381,531 | $890,239 |
| 2014 | $18,760 | $1,246,858 | $374,057 | $872,801 |
Source: Public Records
Map
Nearby Homes
- 8215 Skyline Cir
- 7796 Surrey Ln
- 7961 Phaeton Dr
- 8153 Surrey Ln
- 700 Canyon Oaks Dr Unit H
- 141 Mountain Valley St
- 760 Canyon Oaks Dr Unit D
- 635 Canyon Oaks Dr Unit A
- 635 Canyon Oaks Dr Unit B
- 630 Canyon Oaks Dr Unit B
- 510 Canyon Oaks Dr Unit C
- 55 Turtle Creek St
- 480 Canyon Oaks Dr Unit G
- 93 Thousand Oaks St
- 4346 Short Hill Rd
- 2 Graham Place
- 4336 Rilea Way
- 4145 Oak Hill Rd
- 142 Sequoyah View Dr
- 2 Sequoyah View Dr
- 14200 Skyline Blvd
- 14240 Skyline Blvd
- 14225 Skyline Blvd
- 14170 Skyline Blvd
- 14270 Skyline Blvd
- 14201 Skyline Blvd
- 14151 Skyline Blvd
- 14150 Skyline Blvd
- 14290 Skyline Blvd
- 14133 Skyline Blvd
- 14300 Skyline Blvd
- 14122 Skyline Blvd
- 14121 Skyline Blvd
- 14330 Skyline Blvd
- 14100 Skyline Blvd
- 14350 Skyline Blvd
- 14109 Skyline Blvd
- 7920 Surrey Ln
- 14360 Skyline Blvd
- 7930 Surrey Ln