1424 Cape St Ashfield, MA 01330
Ashfield NeighborhoodEstimated Value: $485,000 - $971,000
3
Beds
3
Baths
2,250
Sq Ft
$309/Sq Ft
Est. Value
About This Home
This home is located at 1424 Cape St, Ashfield, MA 01330 and is currently estimated at $694,918, approximately $308 per square foot. 1424 Cape St is a home located in Franklin County with nearby schools including Mohawk Trail Regional High School.
Ownership History
Date
Name
Owned For
Owner Type
Purchase Details
Closed on
Dec 8, 2021
Sold by
Southwick Renee E
Bought by
Renee E Southwick Ret
Current Estimated Value
Purchase Details
Closed on
Jan 19, 1996
Sold by
Whiteley Daniel S and York-Whiteley Cheri
Bought by
Southwick Renee E
Home Financials for this Owner
Home Financials are based on the most recent Mortgage that was taken out on this home.
Original Mortgage
$165,500
Interest Rate
7.16%
Mortgage Type
Purchase Money Mortgage
Create a Home Valuation Report for This Property
The Home Valuation Report is an in-depth analysis detailing your home's value as well as a comparison with similar homes in the area
Home Values in the Area
Average Home Value in this Area
Purchase History
| Date | Buyer | Sale Price | Title Company |
|---|---|---|---|
| Renee E Southwick Ret | -- | None Available | |
| Southwick Renee E | $210,587 | -- |
Source: Public Records
Mortgage History
| Date | Status | Borrower | Loan Amount |
|---|---|---|---|
| Previous Owner | Southwick Renee E | $134,000 | |
| Previous Owner | Southwick Renee E | $25,000 | |
| Previous Owner | Southwick Renee E | $165,500 | |
| Previous Owner | Southwick Renee E | $121,000 |
Source: Public Records
Tax History Compared to Growth
Tax History
| Year | Tax Paid | Tax Assessment Tax Assessment Total Assessment is a certain percentage of the fair market value that is determined by local assessors to be the total taxable value of land and additions on the property. | Land | Improvement |
|---|---|---|---|---|
| 2025 | $8,289 | $615,800 | $133,500 | $482,300 |
| 2024 | $8,287 | $567,200 | $133,500 | $433,700 |
| 2023 | $8,104 | $460,200 | $110,800 | $349,400 |
| 2022 | $7,668 | $441,200 | $107,300 | $333,900 |
| 2021 | $4,063 | $402,000 | $107,300 | $294,700 |
| 2020 | $6,527 | $391,800 | $107,300 | $284,500 |
| 2019 | $110 | $380,000 | $106,100 | $273,900 |
| 2018 | $6,451 | $375,500 | $106,100 | $269,400 |
| 2017 | $47 | $381,500 | $105,200 | $276,300 |
| 2016 | $5,634 | $342,700 | $105,200 | $237,500 |
| 2015 | $5,473 | $342,700 | $105,200 | $237,500 |
| 2014 | $5,414 | $335,000 | $97,400 | $237,600 |
Source: Public Records
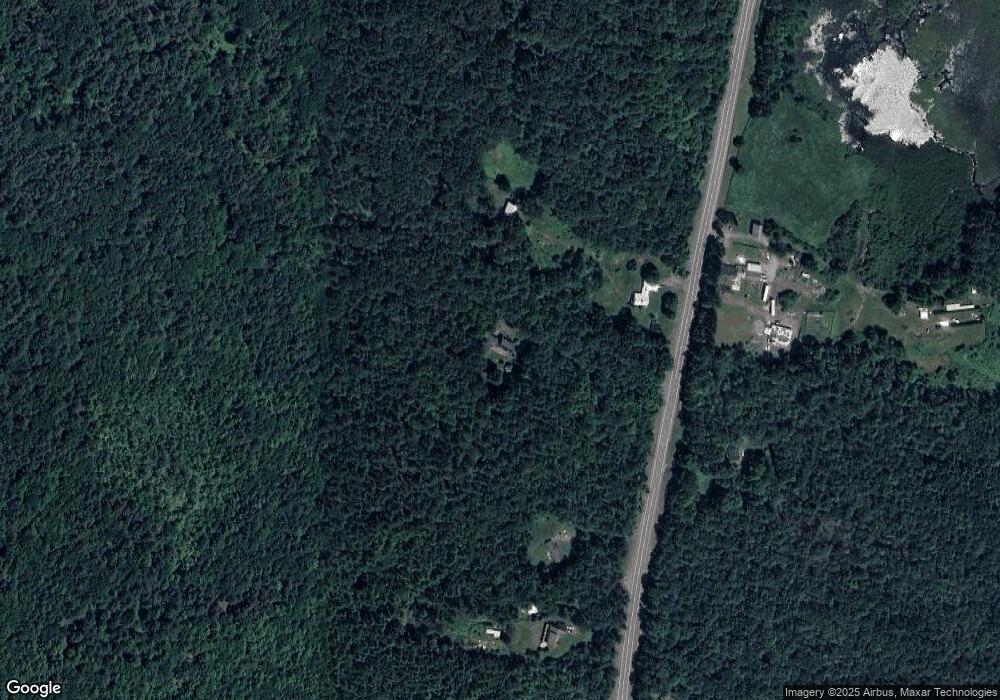
Map
Nearby Homes
- 0 Sears Rd Unit 73373850
- 0 Spruce Corner Rd Unit 73244975
- 0 John Ford Rd Unit 73403157
- 0 John Ford Rd Unit 73403156
- 333 Ranney Corner Rd
- 374 Watson Spruce Corner Rd
- 146 Berkshire Trail W
- 220 Hawley Rd
- 1531 Williamsburg Rd
- 230 S Ashfield Rd
- 473 N Poland Rd
- 240 Beldingville Rd
- 0 Old Stage Rd Unit 73326639
- 0 Fuller Rd
- 7 Sundown Dr
- 820 E Guinea Rd
- 29 Union St
- 0 Ashfield Rd
- 54 Porter Hill Rd
- 33 Washington Rd